'%20d='M0%208a8%208%200%200%201%208-8h24a8%208%200%200%201%208%208v24a8%208%200%200%201-8%208H8a8%208%200%200%201-8-8V8Z'/%3e%3cpath%20fill='%23fff'%20d='M10.41%206v3.779h15.048v19.537h4.132V6H10.41Z'/%3e%3cpath%20fill='%23fff'%20d='M20.967%2034V13.837L10.41%209.78v20.166L20.967%2034Z'/%3e%3cdefs%3e%3clinearGradient%20id='reapit-sales__a'%20x1='20.702'%20x2='20.702'%20y1='.351'%20y2='31.228'%20gradientUnits='userSpaceOnUse'%3e%3cstop%20stop-color='%235573FD'/%3e%3cstop%20offset='.575'%20stop-color='%234E56EA'/%3e%3c/linearGradient%3e%3c/defs%3e%3c/svg%3e)
Listing Activity Report
This article covers the listing activity report settings in Reapit Sales.
Listing Activity Report
This article covers the listing activity report settings in Reapit Sales.
*Note: Only Master Users can access this configuration location. Below we will show you how to customise the colours, header and default display settings for the listing Activity (Vendor/Landlord Feedback) Report.
- Click My Office on the main menu.
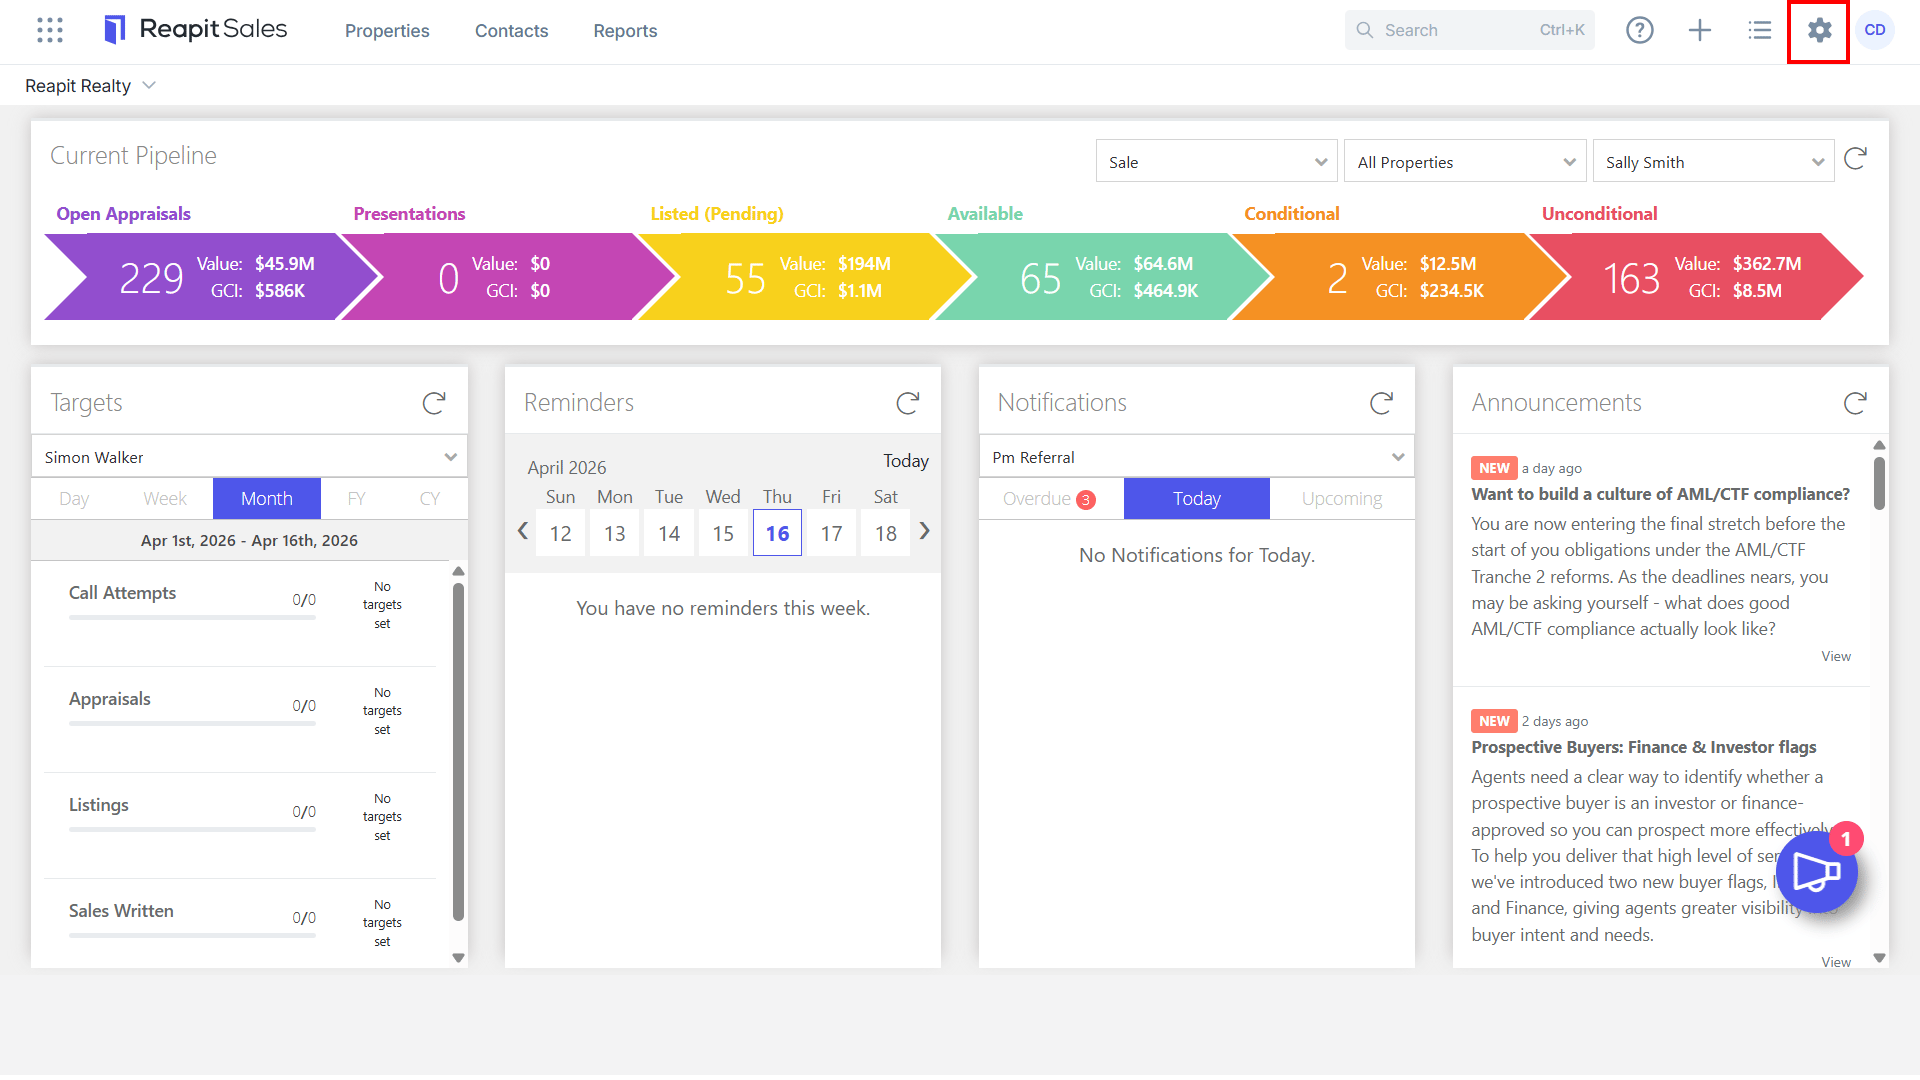
- Click Edit Details on the left panel.
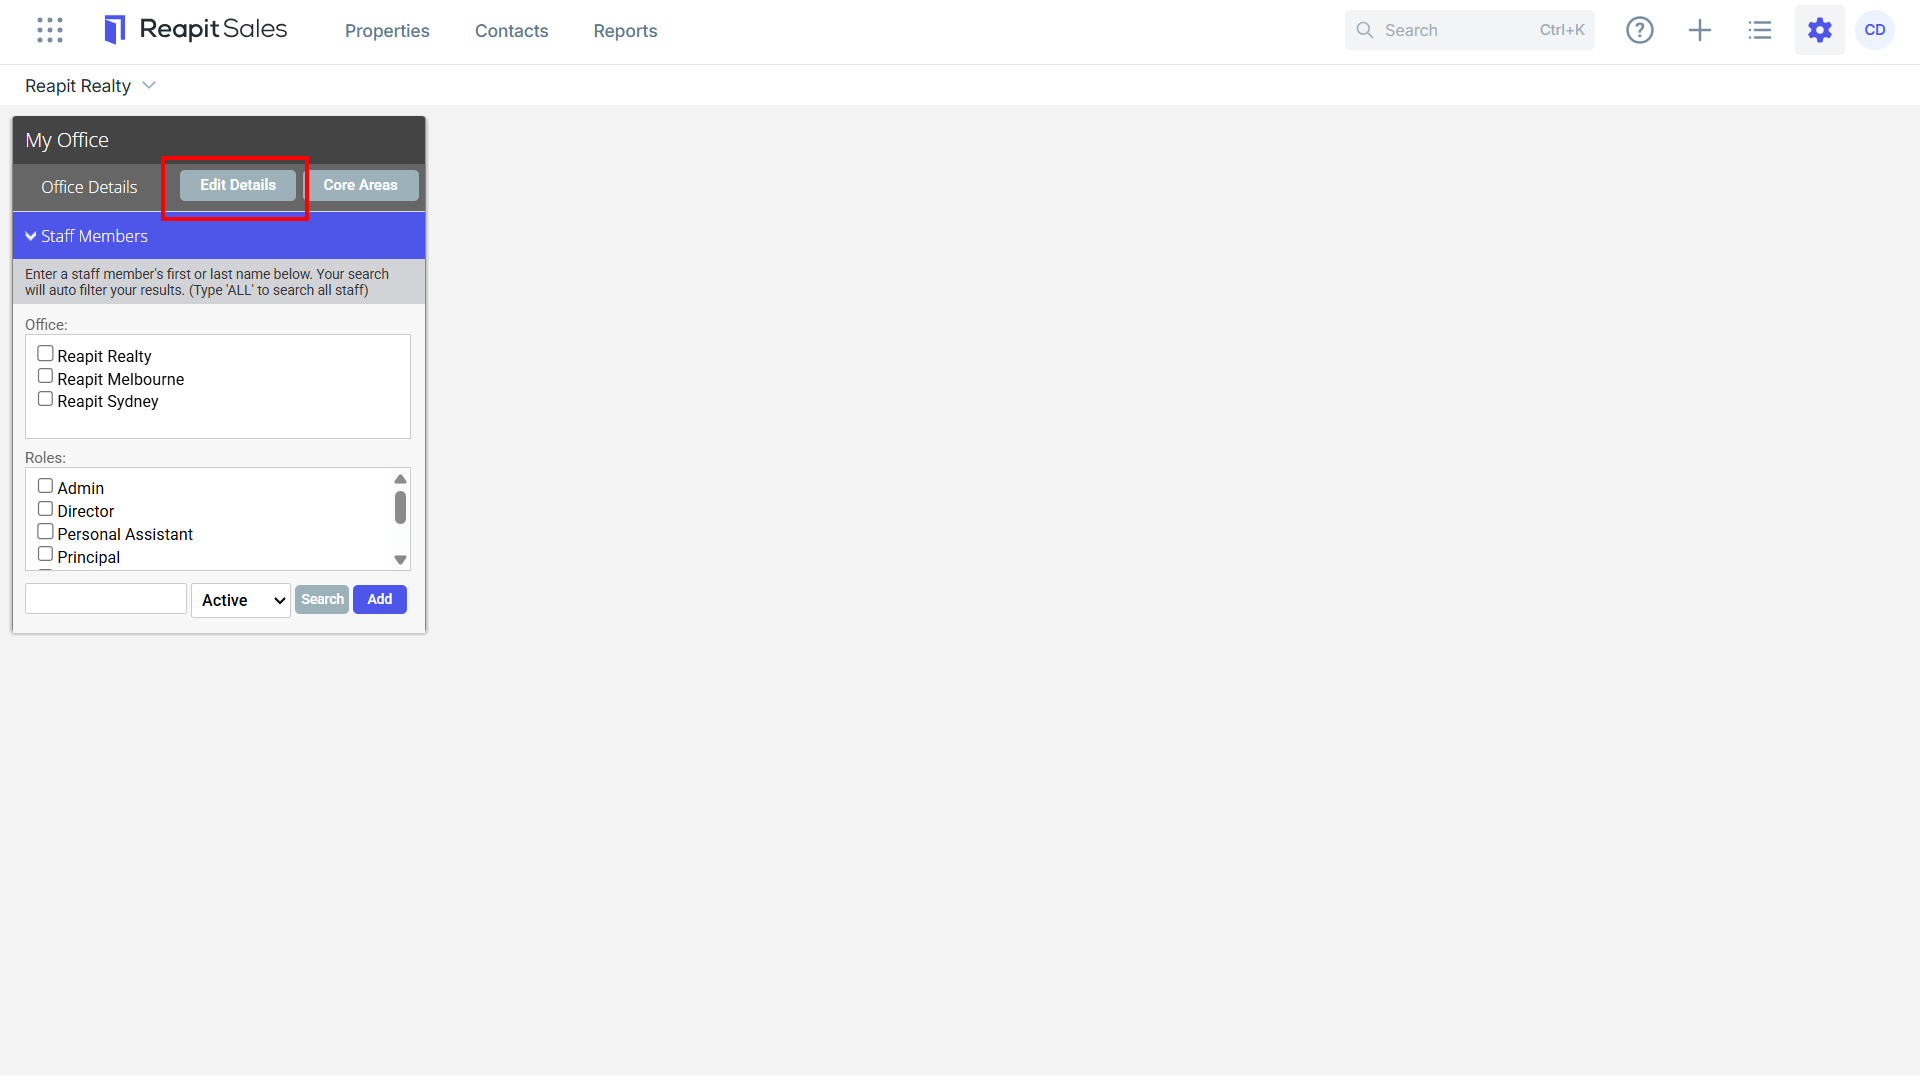
- Click the System Configuration tab.
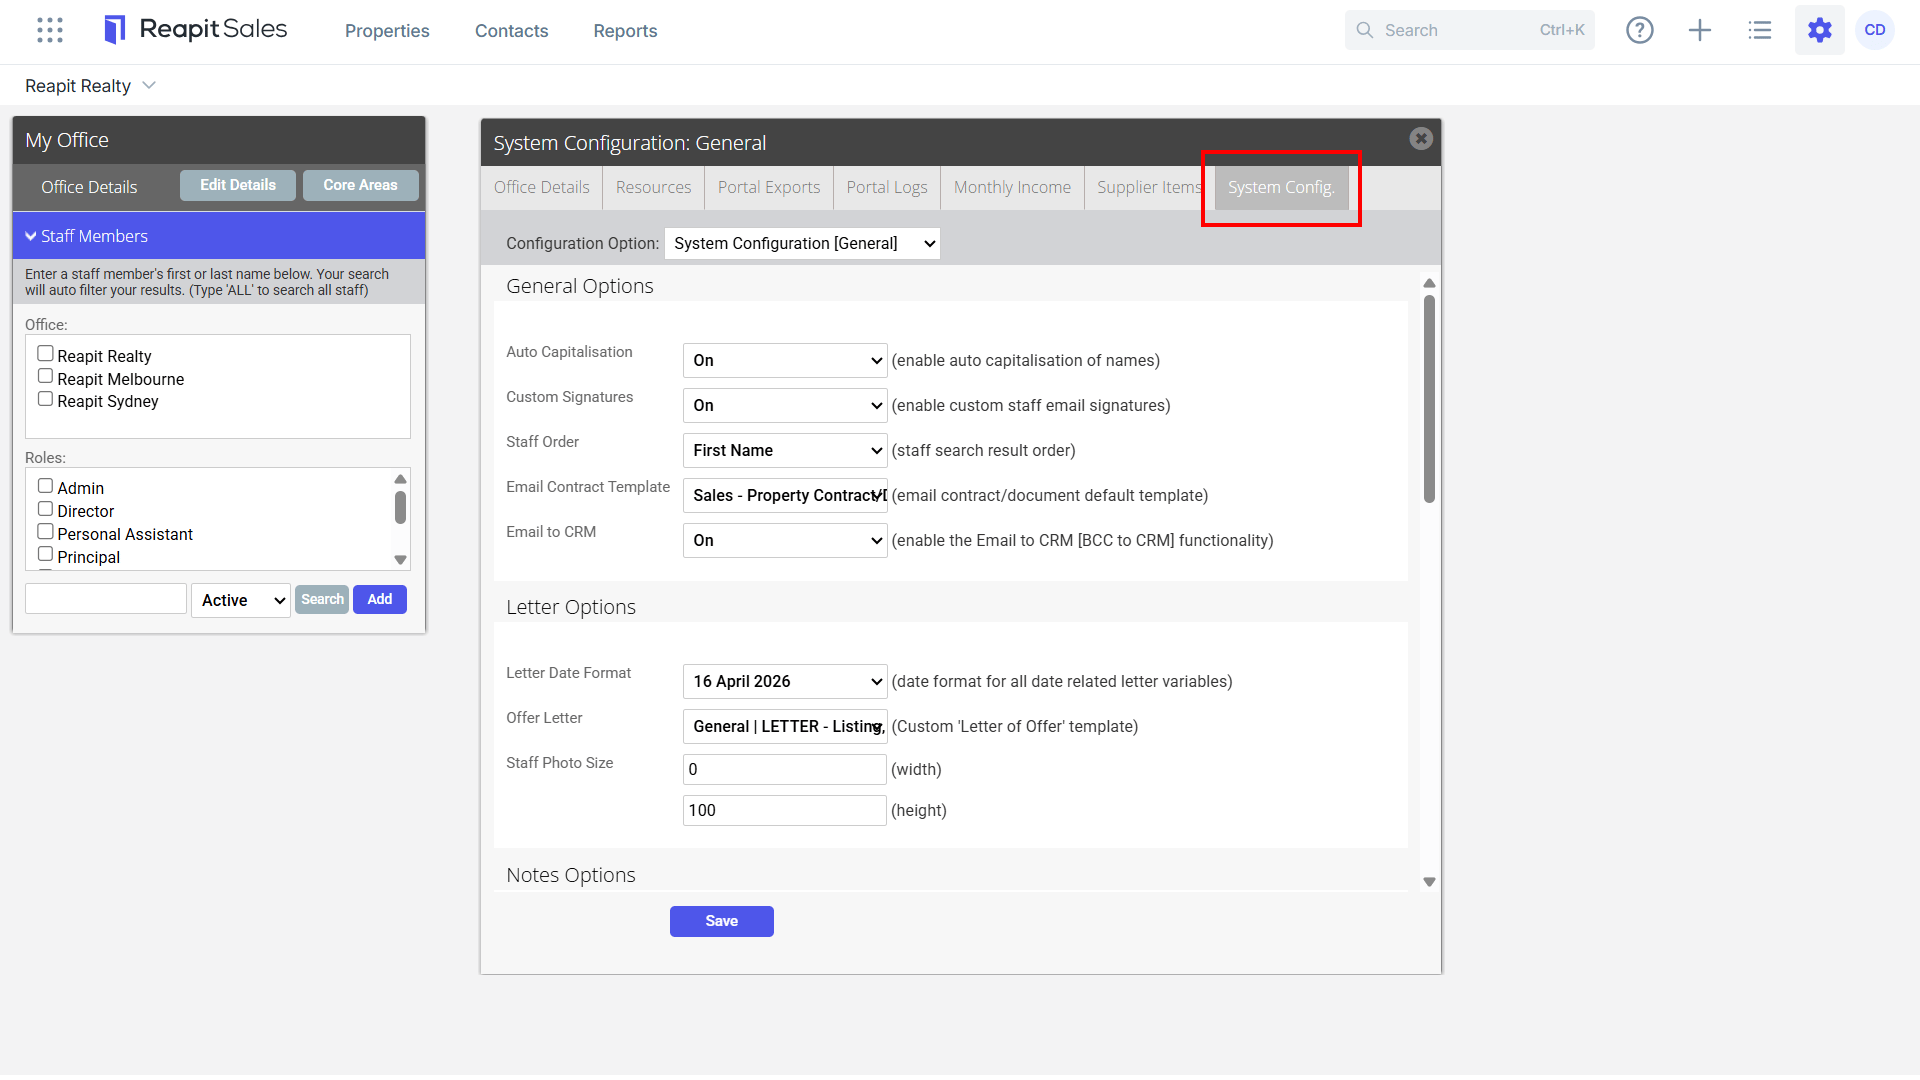
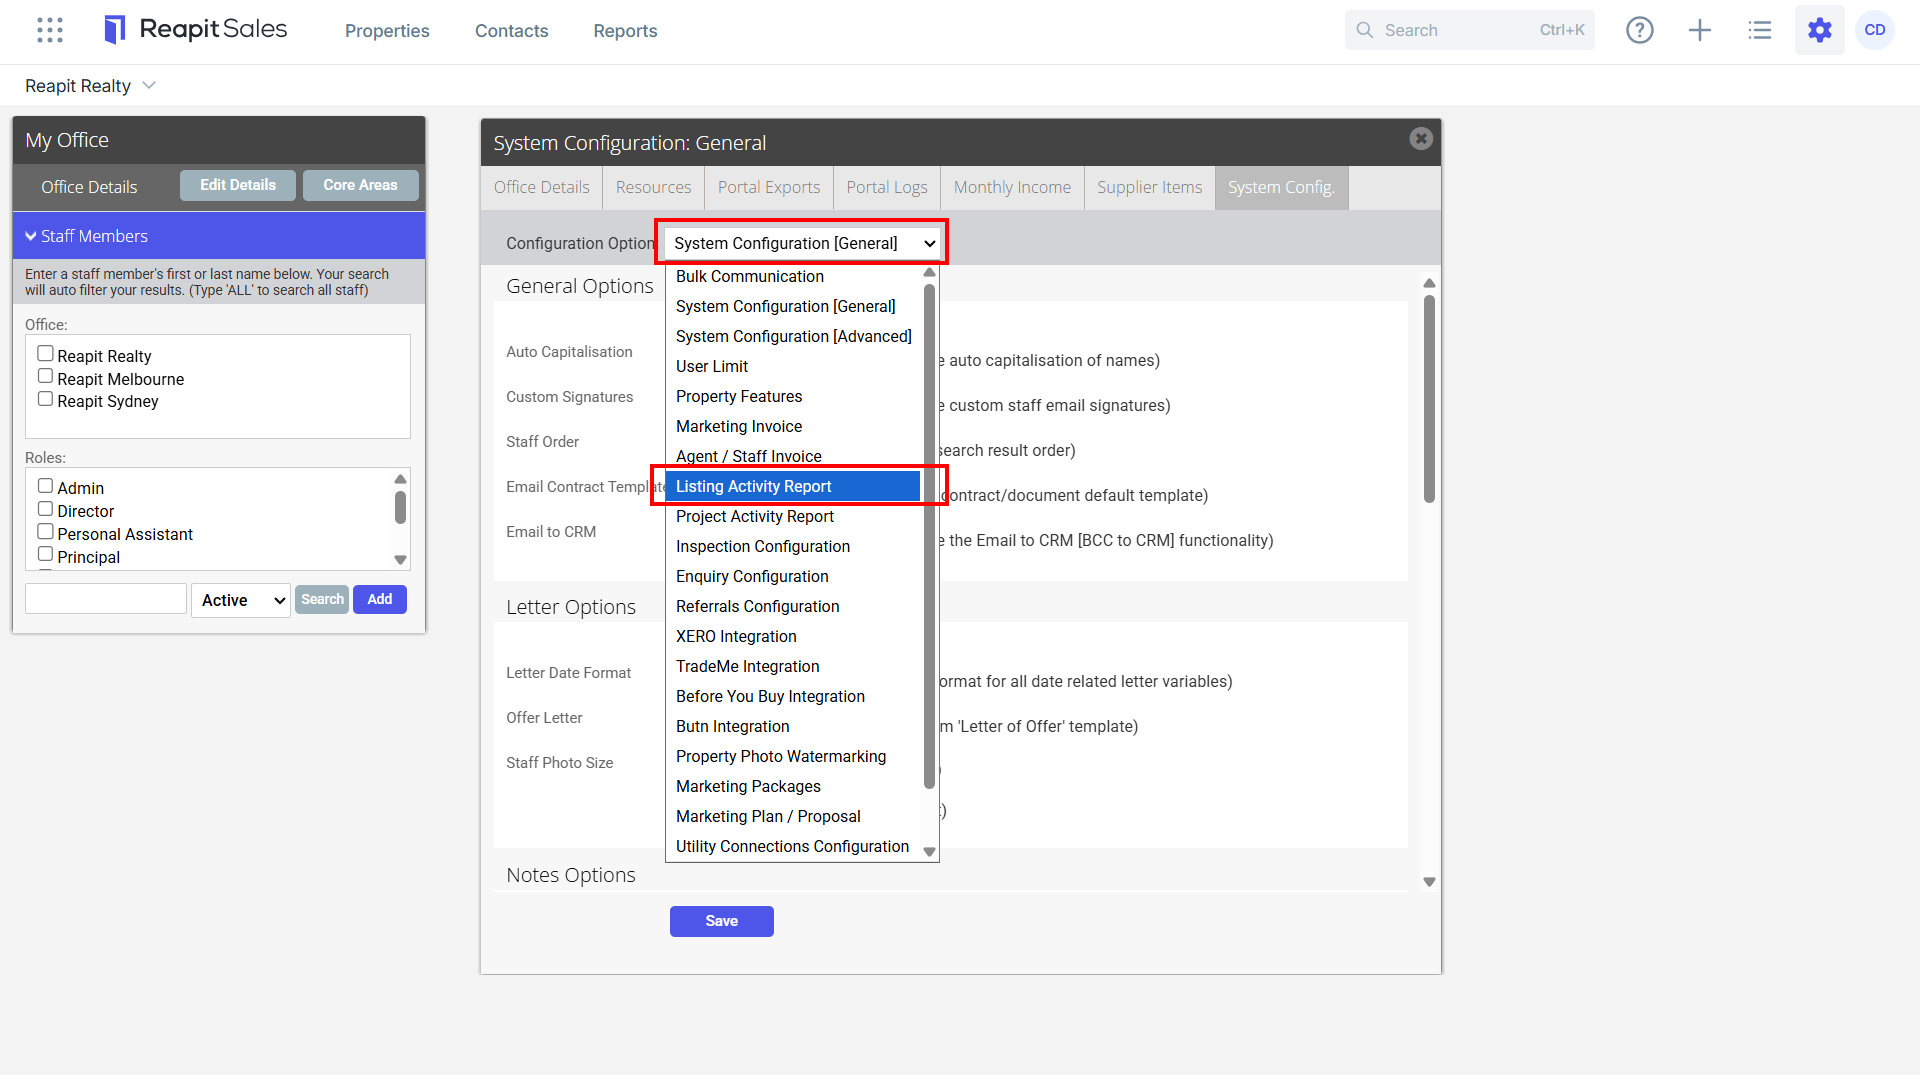
- Select Listing Activity Report from the Configuration Option drop-down.
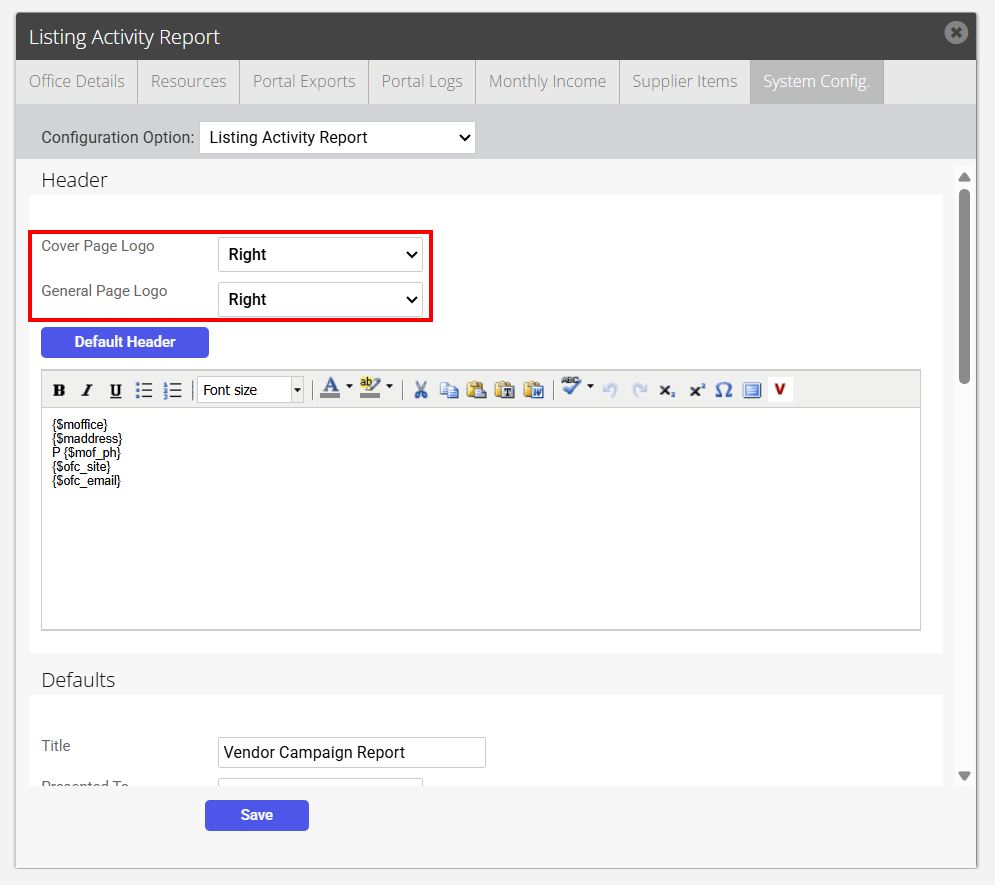
- Cover Page Logo position.
Cover Page Logo: Select your preferred logo position; left, right or off.
General Page Logo: Select your preferred logo position; left, right or off.
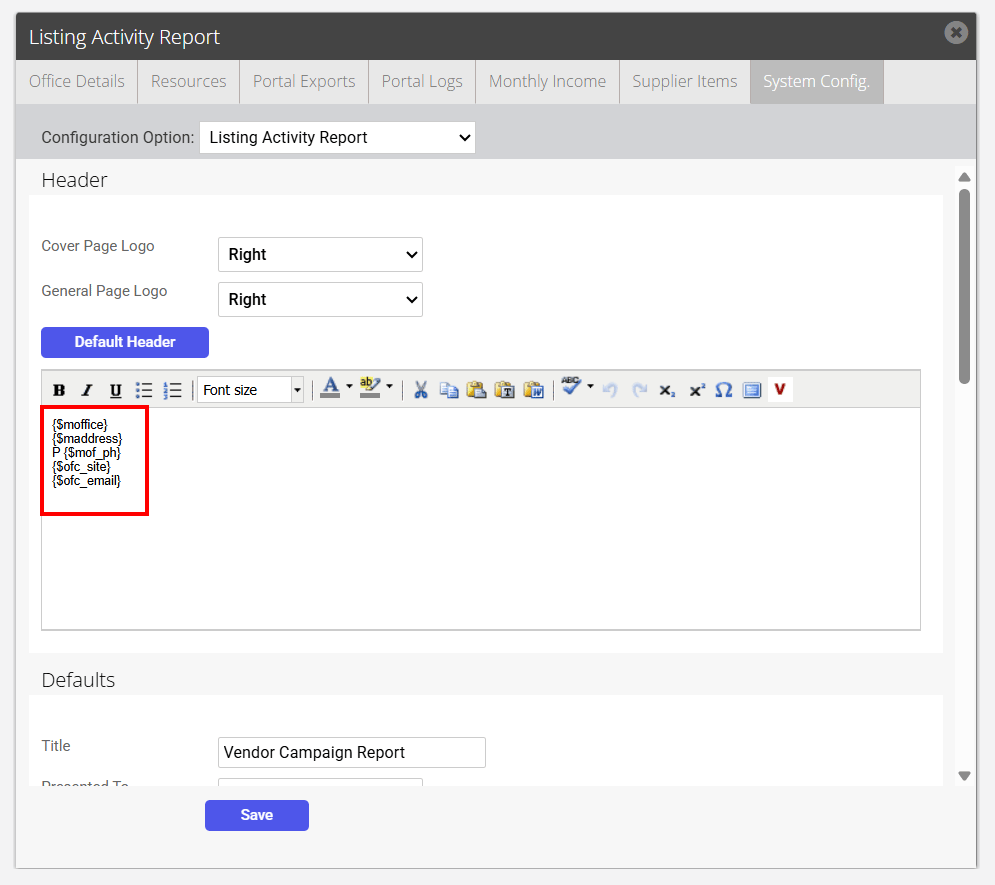
- Use the editing tools to adjust your report header. For example, if you do not want the fax number to appear - remove the variable for fax number.
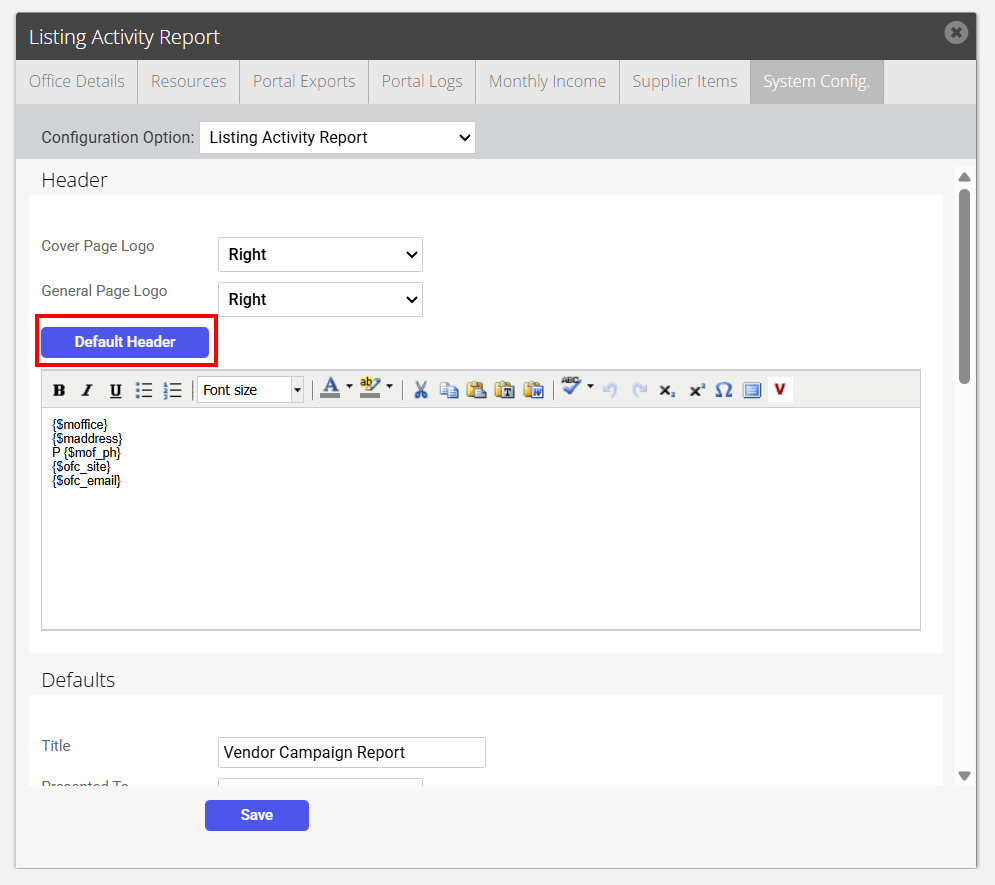
*** Tip:** Select Default Header to return the Header to the default settings.
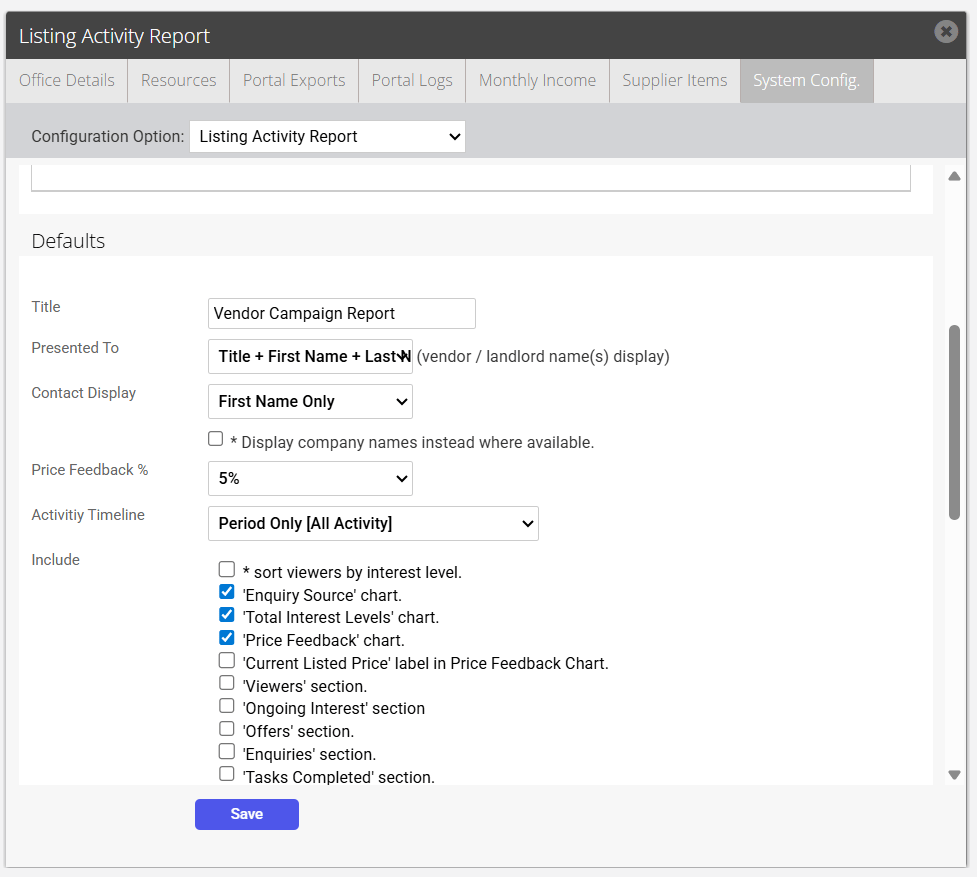
- Defaults - set the defaults for the report that will appear when you generate a new report. Each user can overwrite these options when editing the report.
- Colour Configuration - select your colour preferences for the report.
*Tip: When updating colours we recommend you have a report open so you can see the changes that are being made.
.jpg?Policy=eyJTdGF0ZW1lbnQiOlt7IlJlc291cmNlIjoiaHR0cHM6Ly9kemY4dnF2MjRlcWhnLmNsb3VkZnJvbnQubmV0L3VzZXJmaWxlcy8xMTEyOC8xNDIwNS9ja2ZpbmRlci9pbWFnZXMvMC01LTIxMTA0ODU0NTkoMSkuanBnIiwiQ29uZGl0aW9uIjp7IkRhdGVMZXNzVGhhbiI6eyJBV1M6RXBvY2hUaW1lIjoxNzc2MzEzMDg0fX19XX0_&Signature=mtokb4xMmAOyArj0oIfAQmWyvRs~1dCMJe~Ve-KfSONO~f2vuhkzaFQUx~-~hB-ve0I2k~9k27~51cljvsqlNQxAQaK6Hhm1nIBHcnR2C1NOgjMQYS~llzoH0qojFwm5W60aR5XVukFRgDBtNwH5d9Ks3EeQt5G8cSnVFqqaPl~ySrsGul4~AsfFu7fX~PK4Q66RLpOp37ZGuQMPfWOu3-jngiV1Nby4AMyt8NU2EjwuVL55NiMz7KtxEJR3J7BDWLC4QPjp7b6CEMWSblshk6oI0pp7b203uEtqEUl~y71apo2YDLzCVm~UdJcVLI46-Z44VJ~D-pSy3I5g2EnJVA__&Key-Pair-Id=K2TK3EG287XSFC)
- Click Save to activate changes for All users.

Price Feedback, Interest Levels, Enquiry Source Charts
These charts will only populate if price feedback, interest levels, and enquiry source data has been logged when adding your enquiries and inspections to a listing.
To edit this data, return to the listing and click on Prospective Buyers on the left panel, then click Contacts/Follow Up and add/edit/delete as required.
If no data is present e.g. no enquiry sources added, then the chart will not appear.
If you would like to hide a chart, click inside the red dotted lines of the Activity Report to open the section editor. Scroll down to the Details Display section and from the include checkboxes deselect from 'Enquiry Source Chart', 'Total Interest Levels Chart', and the 'Price Feedback chart' and click Save.
To remove 'Unknown' data where some contacts have not provided feedback, click inside the red dotted lines of the Activity Report to open the section editor. Scroll down to the Details Display section and from the Include checkboxes deselect N/A in price feedback & interest levels charts and click Save.

Understanding the Price Feedback chart.
The price feedback chart consolidates all price feedback received during the campaign, comparing against the listing's search price to sort feedback into three categories: Below, Within and Above a specified percentage of the Search Price. The percentage used can be configured as a default of either 3%, 5%, 7% or 10% and also overridden per-report.
To configure this percentage click inside the red dotted lines of the Activity Report to open the section editor. Scroll down to the Details Display section and select the desired range from the Price Feedback % field and click Save.
Example: For a listing with a Search Price of $500,000 and where the Price Feedback calculation is set to 5%, it will display the 3 options below:
The price feedback chart will display "Below $475,000"
The price feedback chart will display "Between $475,000 and $525,000"
The price feedback chart will display "Above $525,000"
The number of contacts who have provided feedback in each price range is now also totalled and displayed on the doughnut chart in addition to the percentage.