'%20d='M0%208a8%208%200%200%201%208-8h24a8%208%200%200%201%208%208v24a8%208%200%200%201-8%208H8a8%208%200%200%201-8-8V8Z'/%3e%3cpath%20fill='%23fff'%20d='M10.41%206v3.779h15.048v19.537h4.132V6H10.41Z'/%3e%3cpath%20fill='%23fff'%20d='M20.967%2034V13.837L10.41%209.78v20.166L20.967%2034Z'/%3e%3cdefs%3e%3clinearGradient%20id='reapit-sales__a'%20x1='20.702'%20x2='20.702'%20y1='.351'%20y2='31.228'%20gradientUnits='userSpaceOnUse'%3e%3cstop%20stop-color='%235573FD'/%3e%3cstop%20offset='.575'%20stop-color='%234E56EA'/%3e%3c/linearGradient%3e%3c/defs%3e%3c/svg%3e)
View Performance
This article demonstrates how to view and analyse Performance metrics in Reapit Sales.
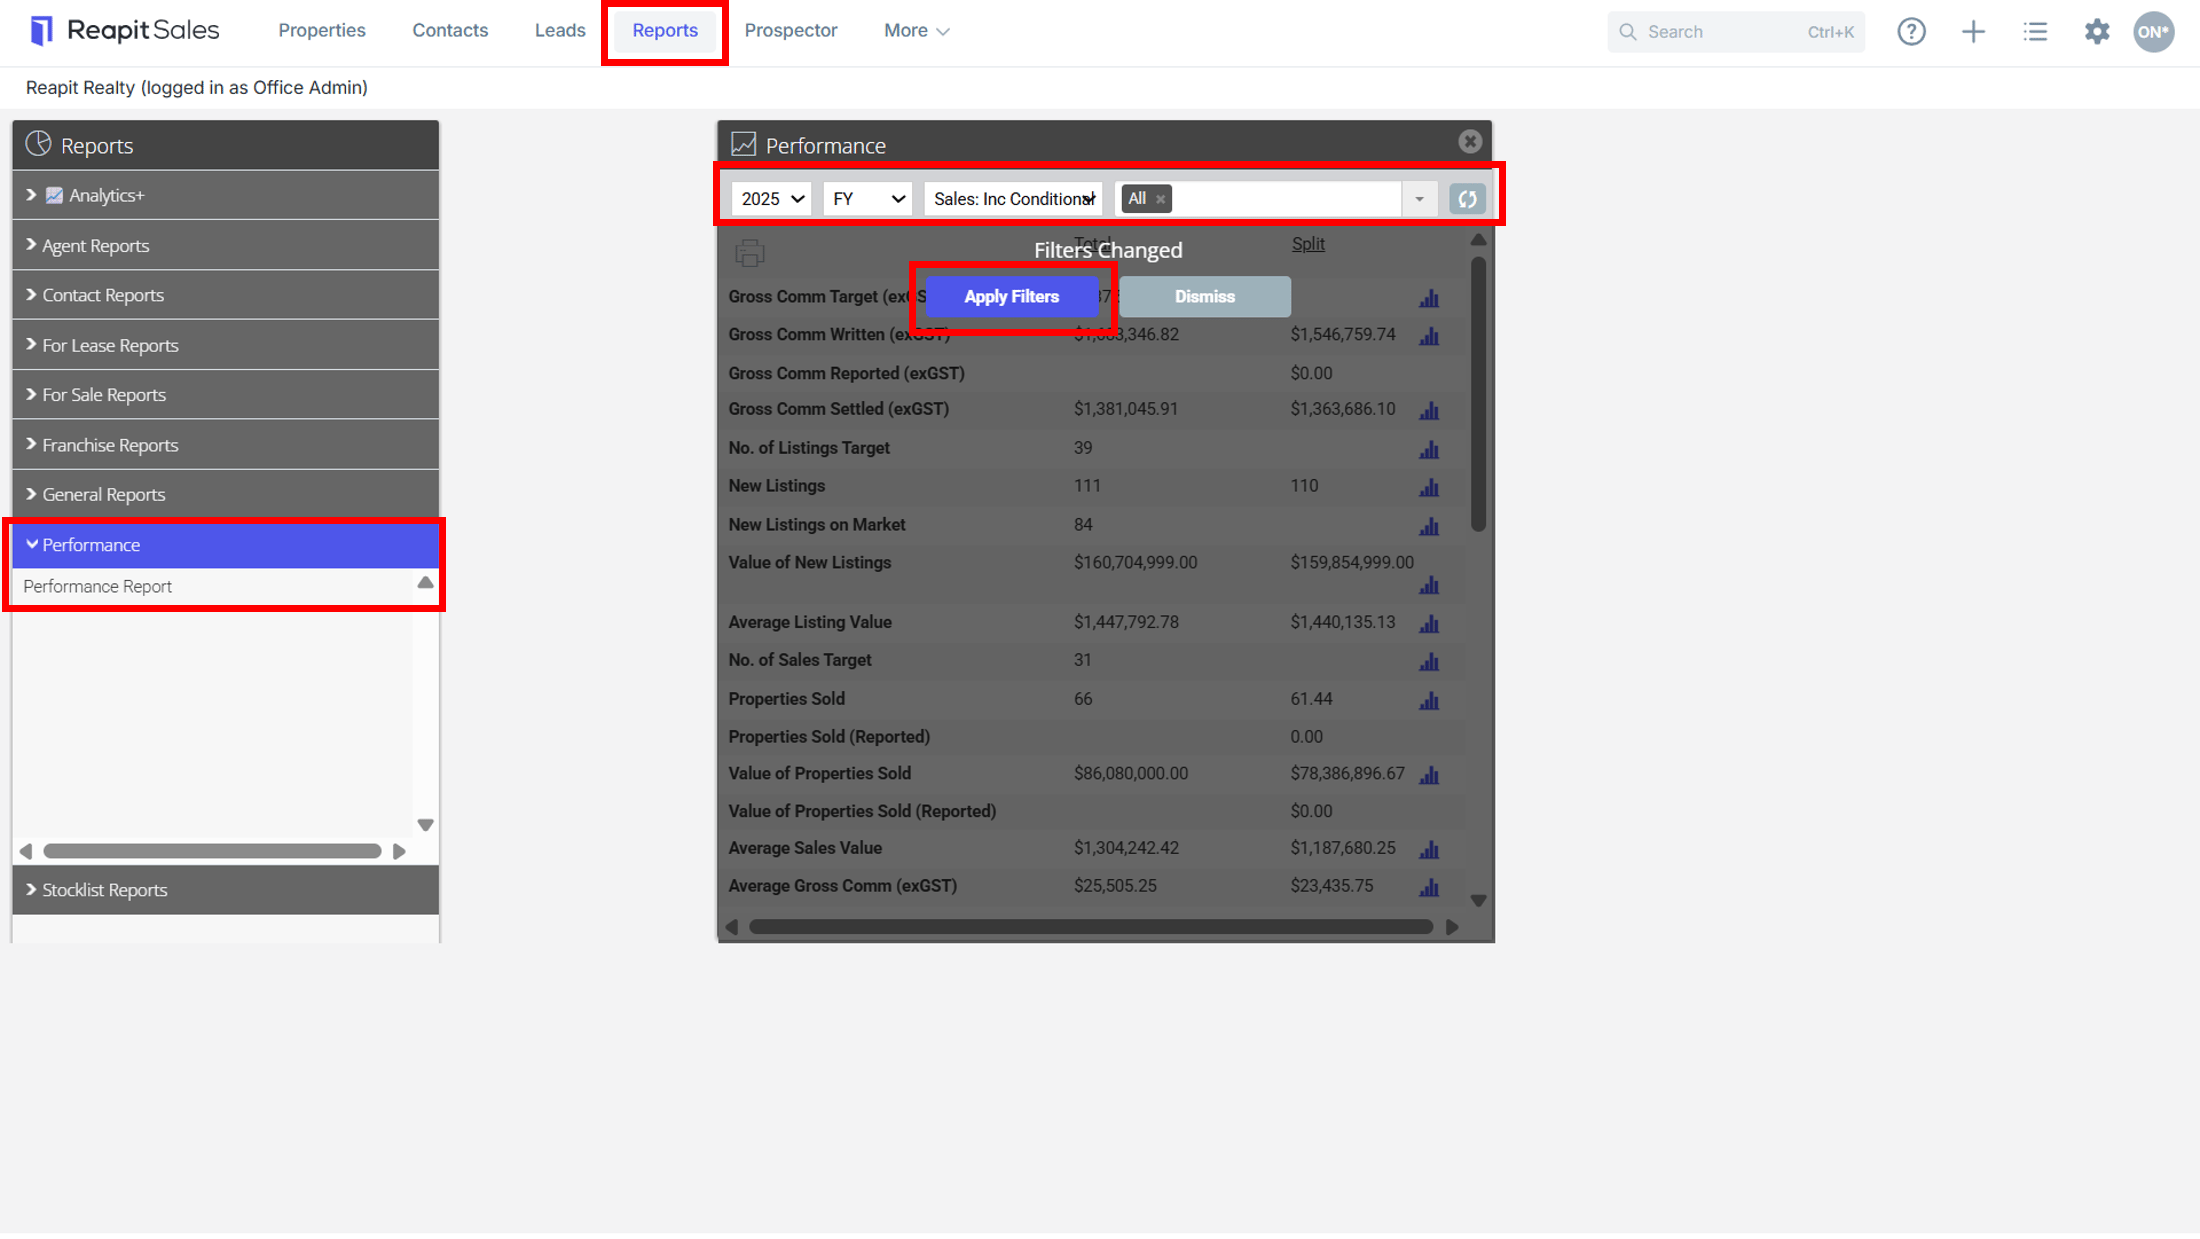
1. Click on Reports.
2. Select Performance > Performance Reports from the Reports Menu.
3. Select the Financial year and office or relevant staff member from the drop-down menus on the left panel. Click Apply Filters to apply the relevant filters. The Refresh icon will allow you to refresh the results based on the current set of filters at any time.
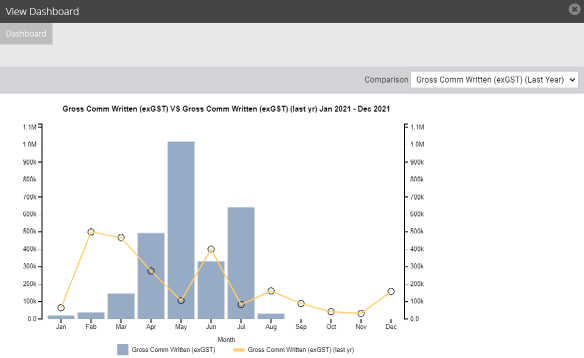
4.Every metric has a drill down report (click on the metric title) & accompanying graph (Click graph icon  ) with the ability to layer comparison metrics.
*Note: The difference between the Total Column and the Split Column, is the Total is what the company has earned, but the Split, is the actual take home for the individual agent once any other internal agent or external conjunctional agent fees are deducted. For example, if two listing agents are assigned to the property they would get 0.5 recognition for that property in performance reporting on the number of New Listings in that period.