'%20d='M0%208a8%208%200%200%201%208-8h24a8%208%200%200%201%208%208v24a8%208%200%200%201-8%208H8a8%208%200%200%201-8-8V8Z'/%3e%3cpath%20fill='%23fff'%20d='M10.41%206v3.779h15.048v19.537h4.132V6H10.41Z'/%3e%3cpath%20fill='%23fff'%20d='M20.967%2034V13.837L10.41%209.78v20.166L20.967%2034Z'/%3e%3cdefs%3e%3clinearGradient%20id='reapit-sales__a'%20x1='20.702'%20x2='20.702'%20y1='.351'%20y2='31.228'%20gradientUnits='userSpaceOnUse'%3e%3cstop%20stop-color='%235573FD'/%3e%3cstop%20offset='.575'%20stop-color='%234E56EA'/%3e%3c/linearGradient%3e%3c/defs%3e%3c/svg%3e)
Sales - Analytics + Reports Summary Part 2
Analytics+ Reporting provides essential metrics, detailed information, interactive dashboards, and options for deeper analysis. Depending on the selected widget, these reports can be exported as an image, PDF, or CSV file using a customisable export tool.
This article encompasses the following key reports:
Part 1 Article
- Agent Commission Report
- Business KPI Report
- Geographical Breakdown Report
- Property Performance Report
- Sales Report
- Staff Performance Report
- Stocklist Report
This Article:
- Group KPIs Report
- Campaign Activity Report
- Projects Report
- Calls Analysis Report
- Agent Benchmarking Report
- Leaderboard Report
- Property Overview Report
- Referrals Report
Additional Information:
- Using Pulse in Analytics+
- Extract and Export Information
See Part 1 of this article: https://help.reapit.com.au/s/article/Sales---Analytics-Reports-Summary-Part-1
Group KPIs Report
Purposes and Benefits of Group KPIs Report:
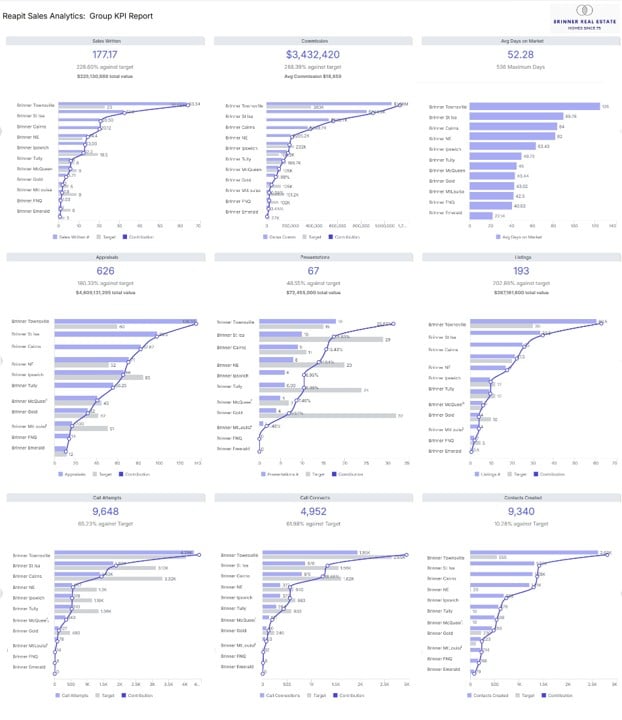
Provides an overview of data to compare performance across a range of KPIs
Group KPI Charts
Sales Written
Commission
Avg Days on Market
Appraisals
Presentations
Listings
Call Attempts
Call Connects
Contacts Created
Campaign Activity Report
Purposes and Benefits of the Campaign Activity Report:
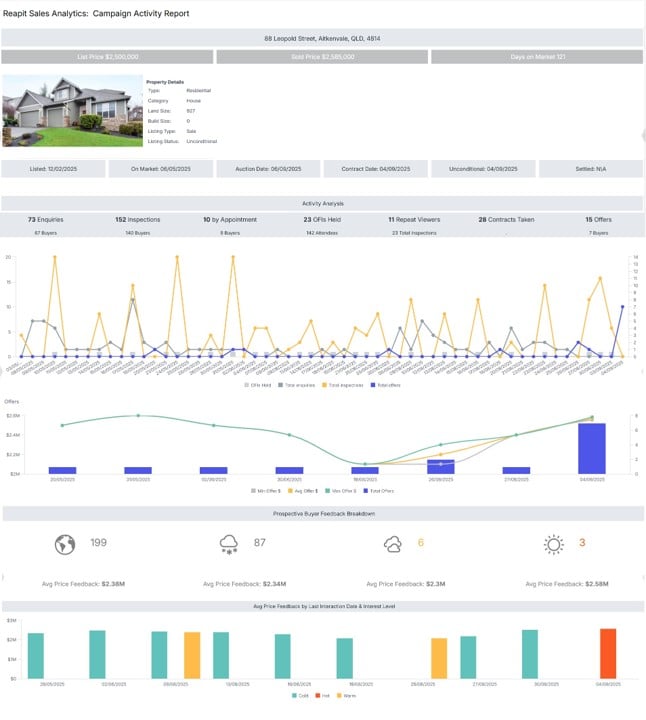
Provides insight into the property activity data and feedback.
Campaign Activity Charts
Property Details
Activity Analysis
Prospective Buyer Feedback Breakdown
Feedback by Last Interaction and Interest Level
Projects Report
Purposes and Benefits of the Projects Report:
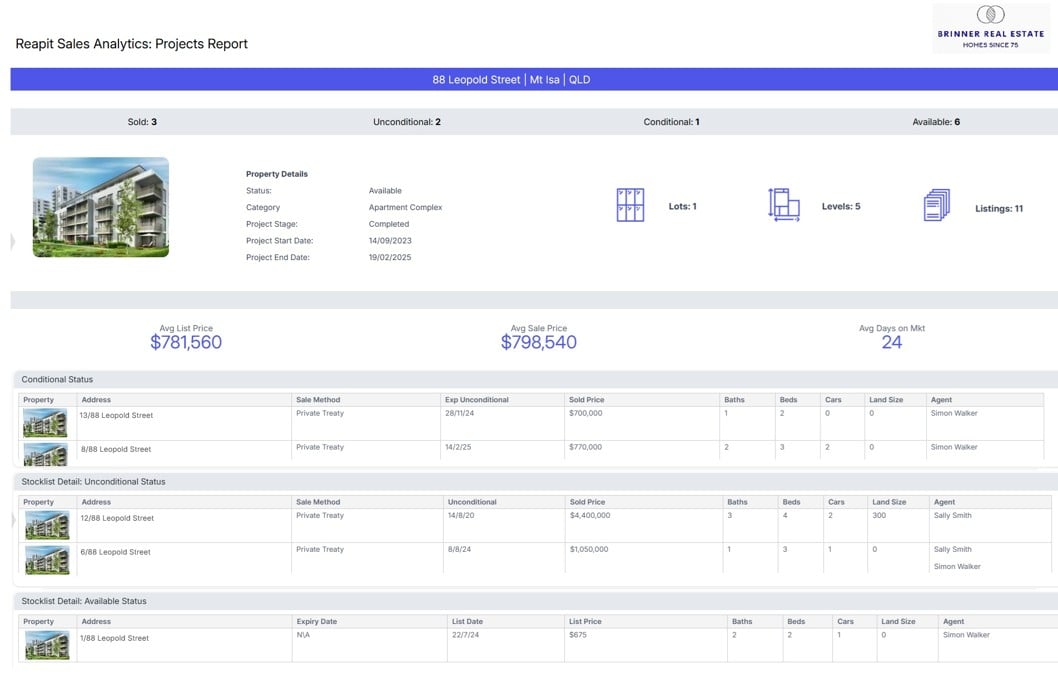
Provides a list of the property details for projects along with stages and status.
Projects Report Charts
- Property Details
- Avg List Price
- Avg Sale Price
- Avg Days on Mkt
- Conditional Status
- Stocklist Details
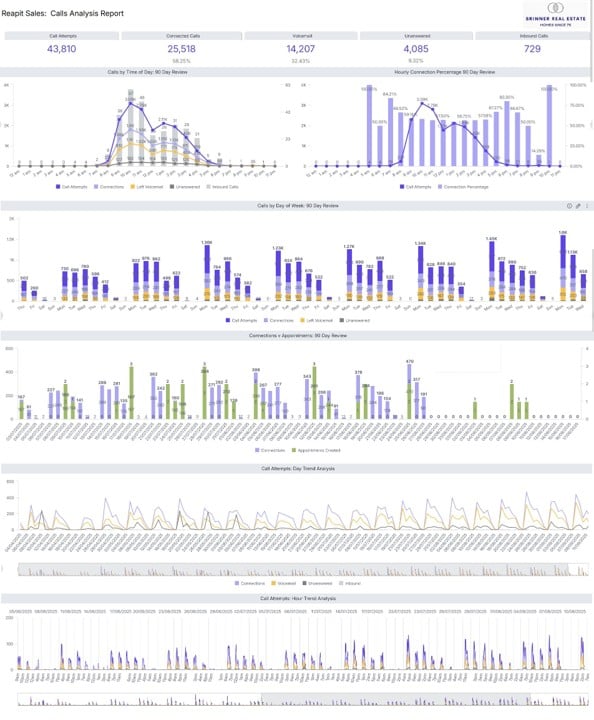
Calls Analysis Report
Purposes and Benefits of the Projects Report:
Provides reports and insight into call data that has been captured.
Calls Analysis Charts
- Call Attempts
- Connected Calls
- Voicemail
- Unanswered
- Inbound Calls
- Calls by Day of Week
- Connections v Appointments
- Call Attempts: Day Trend
- Call Attempts: Hour Trend
Agent Benchmarking Report
This report provides a clear view of how an office and each of its agents are performing against agencies operating in the same localities. Track key metrics such as:
- Sales
- Listings
- Appraisals
- Presentations
All of these metrics can be viewed alongside an 18-month trend.
Leaderboard Report
This report highlights all performers across sales, listings and appraisals, with a clear leaderboard highlighting an office’s top three agents by sales volume. It also introduces the ‘Property Stars’, showcasing standout sales.
Property Overview Report
This report gives agencies a single, clear view of all your active listings, alongside their activity levels which include:
- Days since the last and until the next inspection
- Inspection attendees
- Enquiries
Referrals Report
This report provides visibility into all referral activity occurring between offices within the same Reapit group. It consolidates both inbound and outbound referrals, so users can track how clients move through the network and which office or agent is currently responsible for progressing the opportunity.
Pulse in Analytics+
Pulse offers a streamlined solution for you to effectively manage your KPIs and key metrics, irrespective of the number of dashboards in use. By integrating essential KPIs from diverse dashboards into the Pulse page, users gain a comprehensive and centralised view of your data within a singular location.
Additional Information
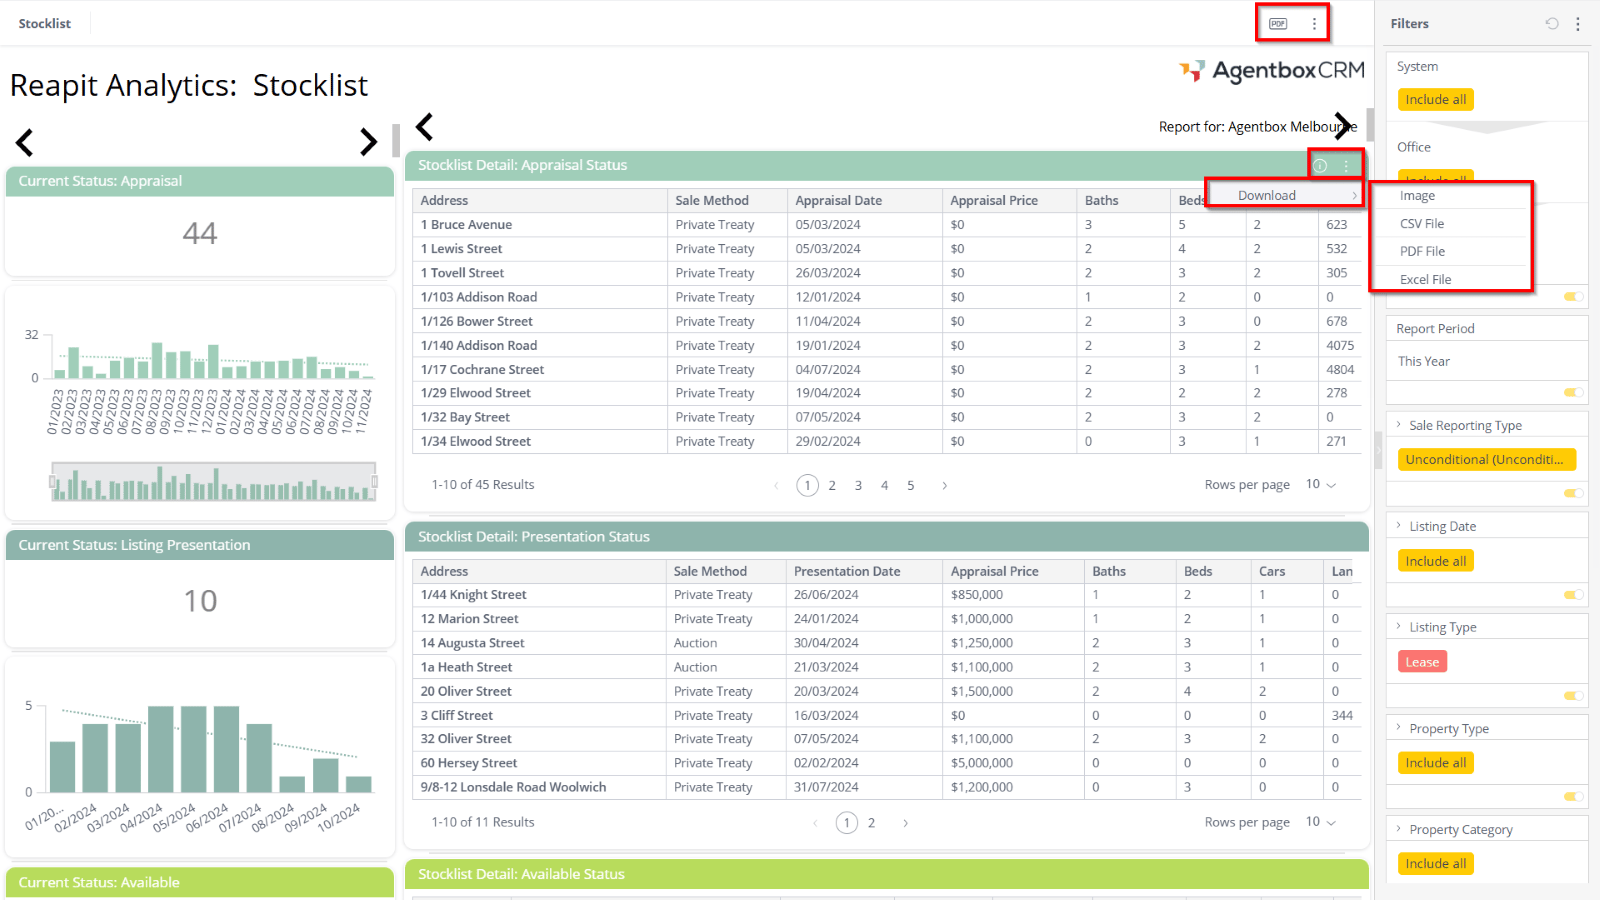
To extract reporting data from Analytics+, click on the three action dots at the top right of any reporting data table. Then, select the desired format to download: Image, CSV, PDF, or Excel file.