'%20d='M0%208a8%208%200%200%201%208-8h24a8%208%200%200%201%208%208v24a8%208%200%200%201-8%208H8a8%208%200%200%201-8-8V8Z'/%3e%3cpath%20fill='%23fff'%20d='M8.375%2013v14L20.5%2034l12.124-7v-7.737l-1.687-.975-2.806-1.62-1.082-.624v4.83l-.002%204.83H13.95V16.07l3.275-1.89%202.192-1.265%201.082-.625%203.275%201.877%202.192%201.256%201.083.62V9.782L20.5%206%208.376%2013Z'/%3e%3cdefs%3e%3clinearGradient%20id='reapit-pm__a'%20x1='20.702'%20x2='20.702'%20y1='.351'%20y2='31.228'%20gradientUnits='userSpaceOnUse'%3e%3cstop%20stop-color='%235573FD'/%3e%3cstop%20offset='.575'%20stop-color='%234E56EA'/%3e%3c/linearGradient%3e%3c/defs%3e%3c/svg%3e)
Introduction to Analyticsᐩ
Analyticsᐩ Reports provide key metrics, granular information, interactive dashboards and drill down options. Reports can be exported to excel or printed via a customisable PDF tool. Information in this article includes: Accessing Reports Report Overview Interacting with Charts Adding a Forecast Export to PDF
Analyticsᐩ Reports provide key metrics, granular information, interactive dashboards and drill down options. Reports can be exported to excel or printed via a customisable PDF tool.
The analytics suite has standard reporting, plus additional reports available to Premium users.
In total there are 52 reports which are designed to provide data driven decision making in your business.
There are a number of key functions included in Analyticsᐩ including:
- Forecasting
- Trend Analysis
- Growth Metrics
- PDF Editing
- Drill Down
- Chart Interaction
Watch our Analyticsᐩ training video here.
Information in this article includes:
- Accessing Reports
- Report Overview
- Interacting with Charts
- Adding a Forecast
- Export to PDF
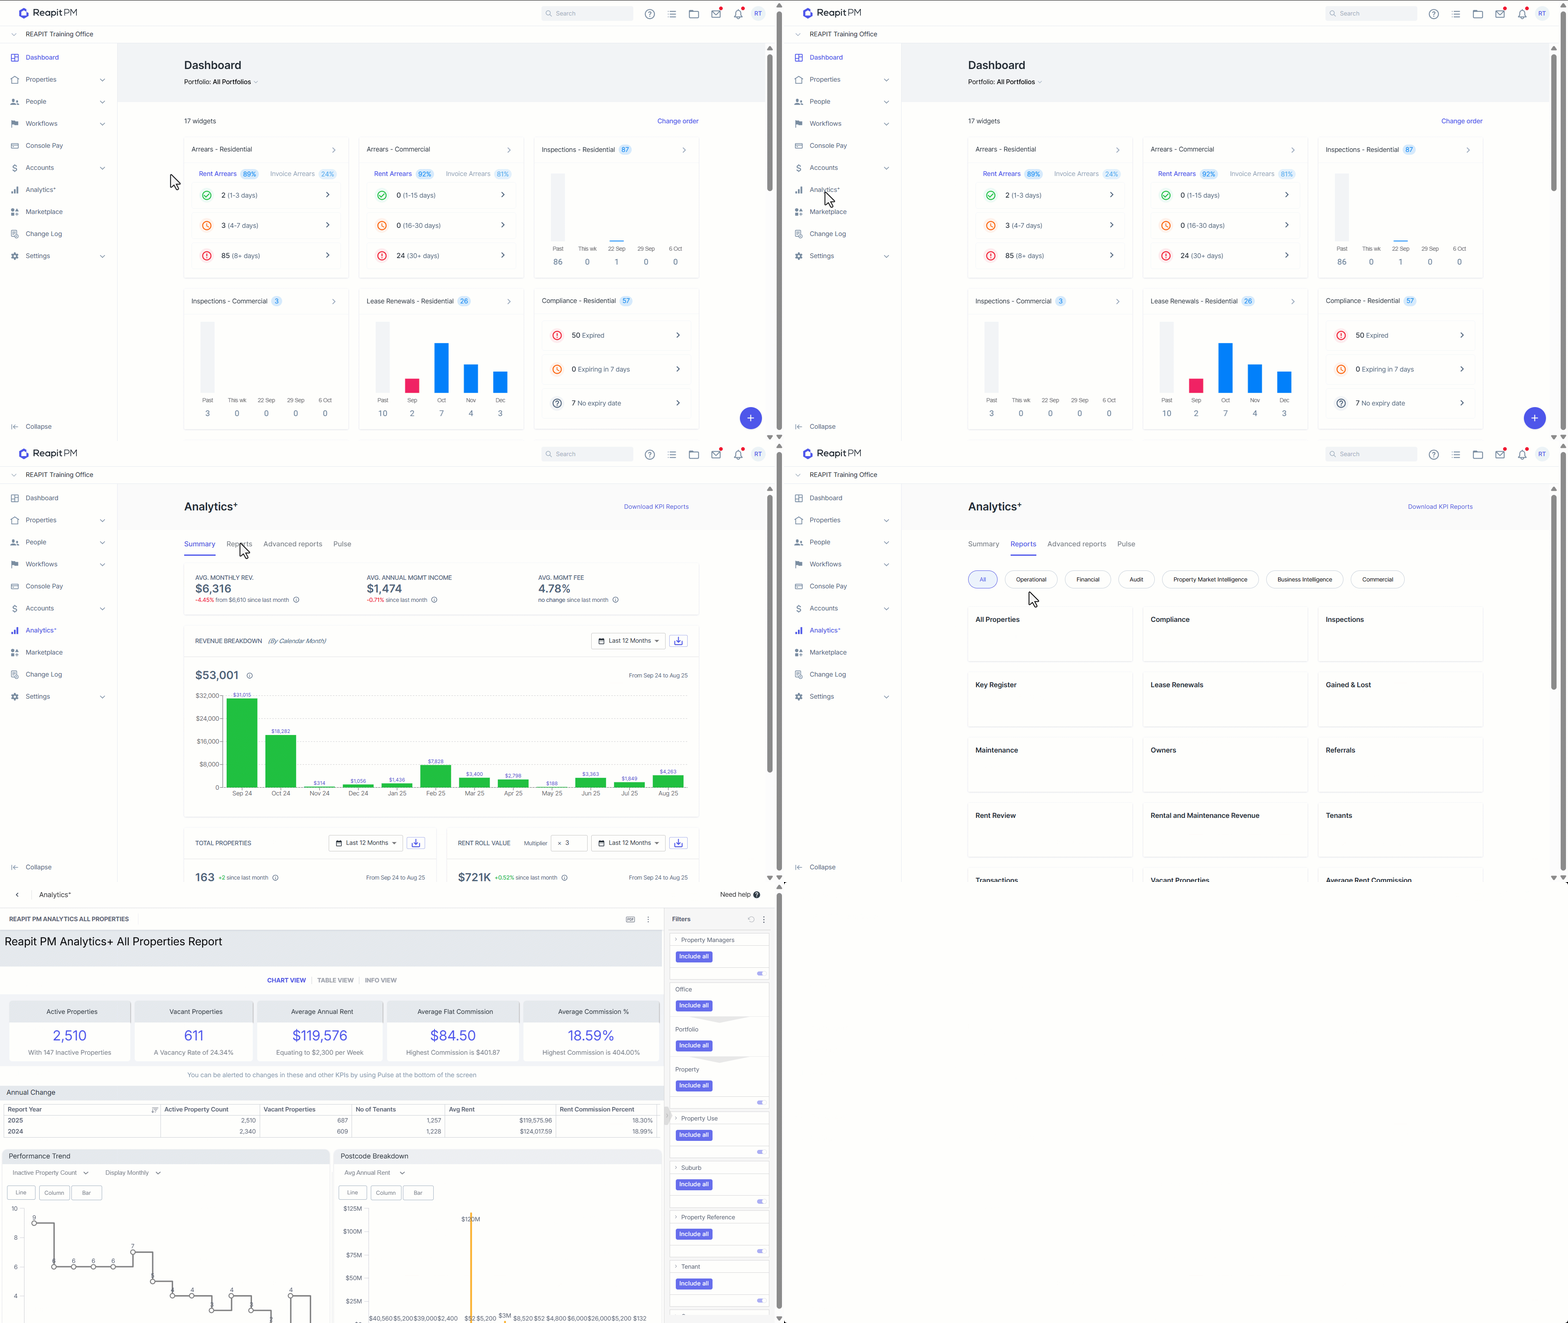
Accessing Reports
- Click on Analyticsᐩ.
- Click on the Reports tab.
- Choose the required report by clicking on the relevant tile.
Report Overview
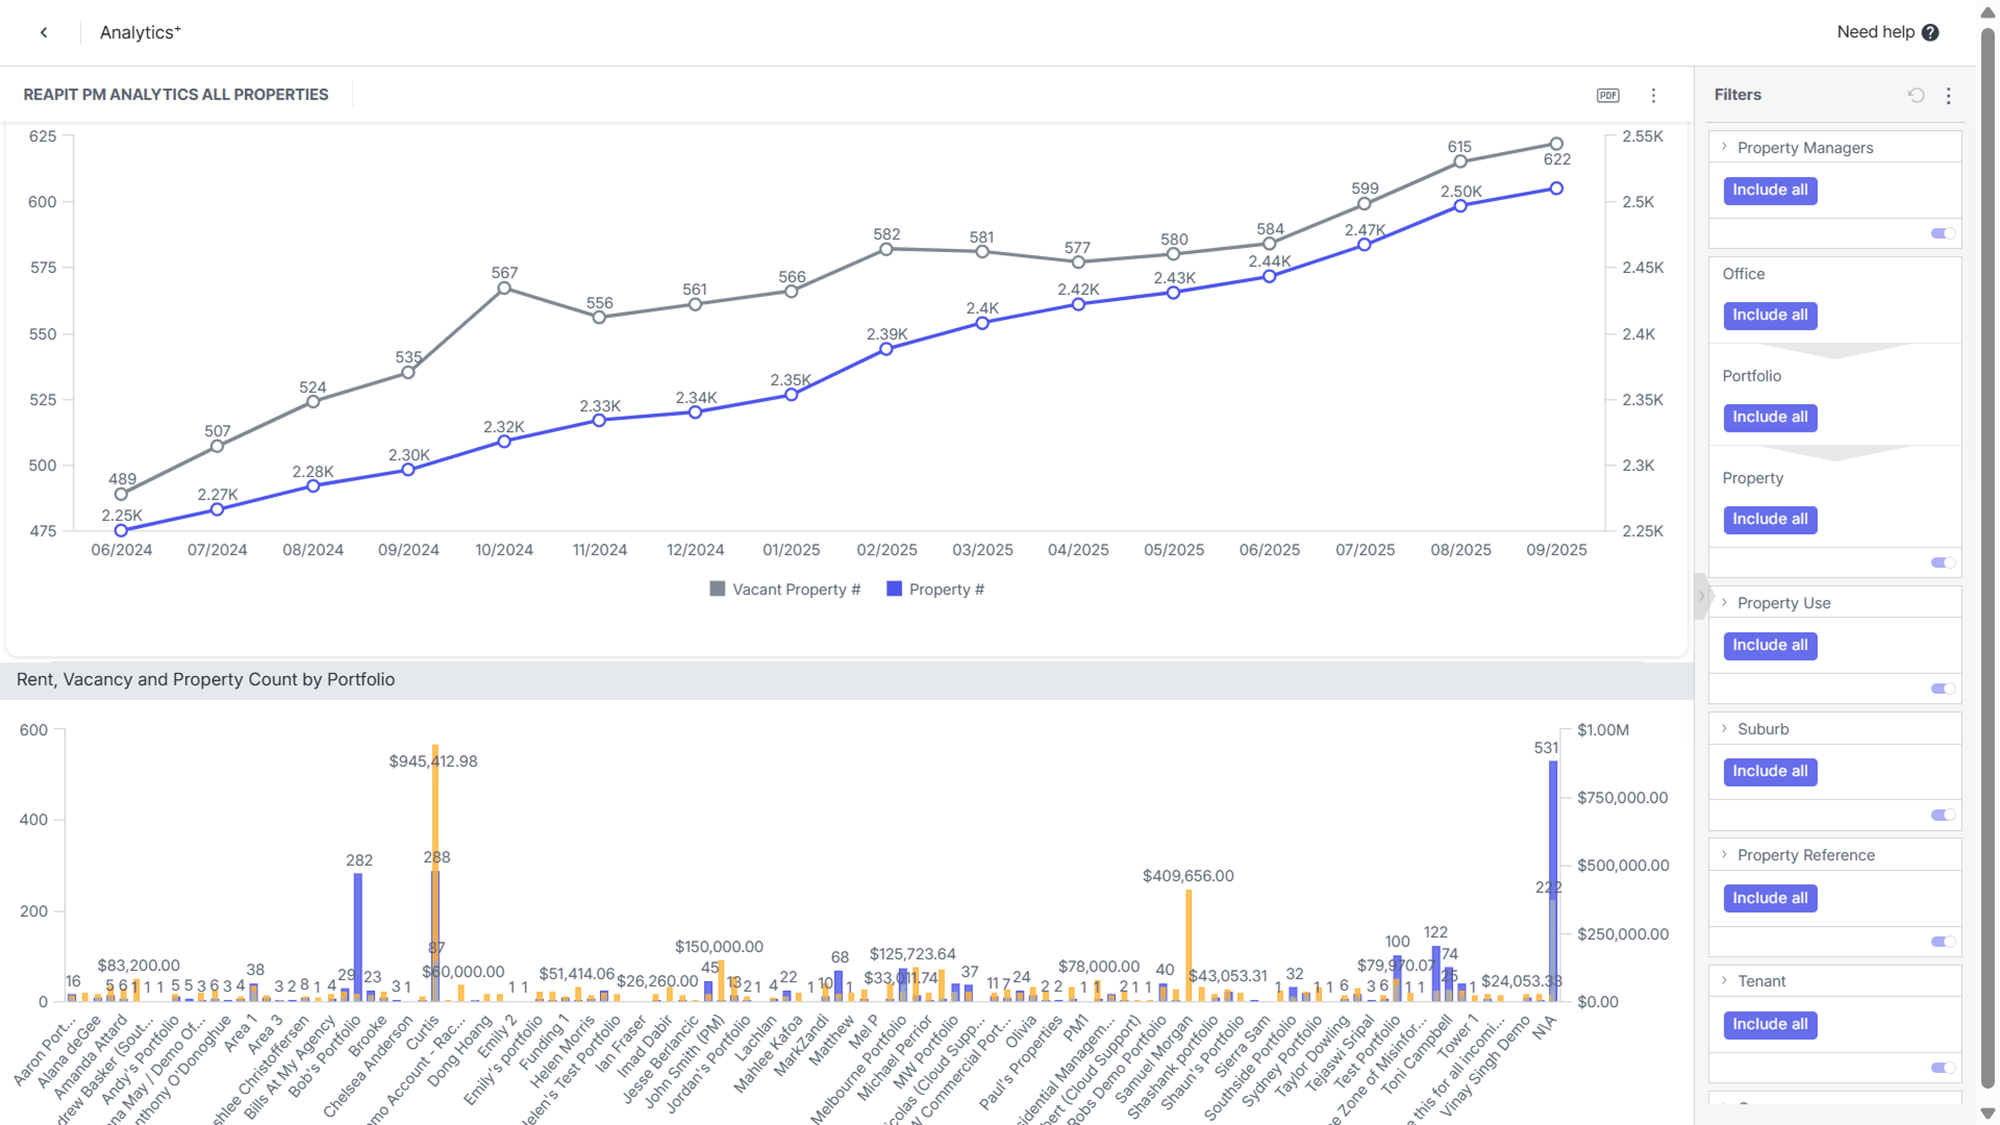
- Reports have KPI and Chart information available.
- Line bar charts can be used to forecast and apply trendlines to specific metrics.
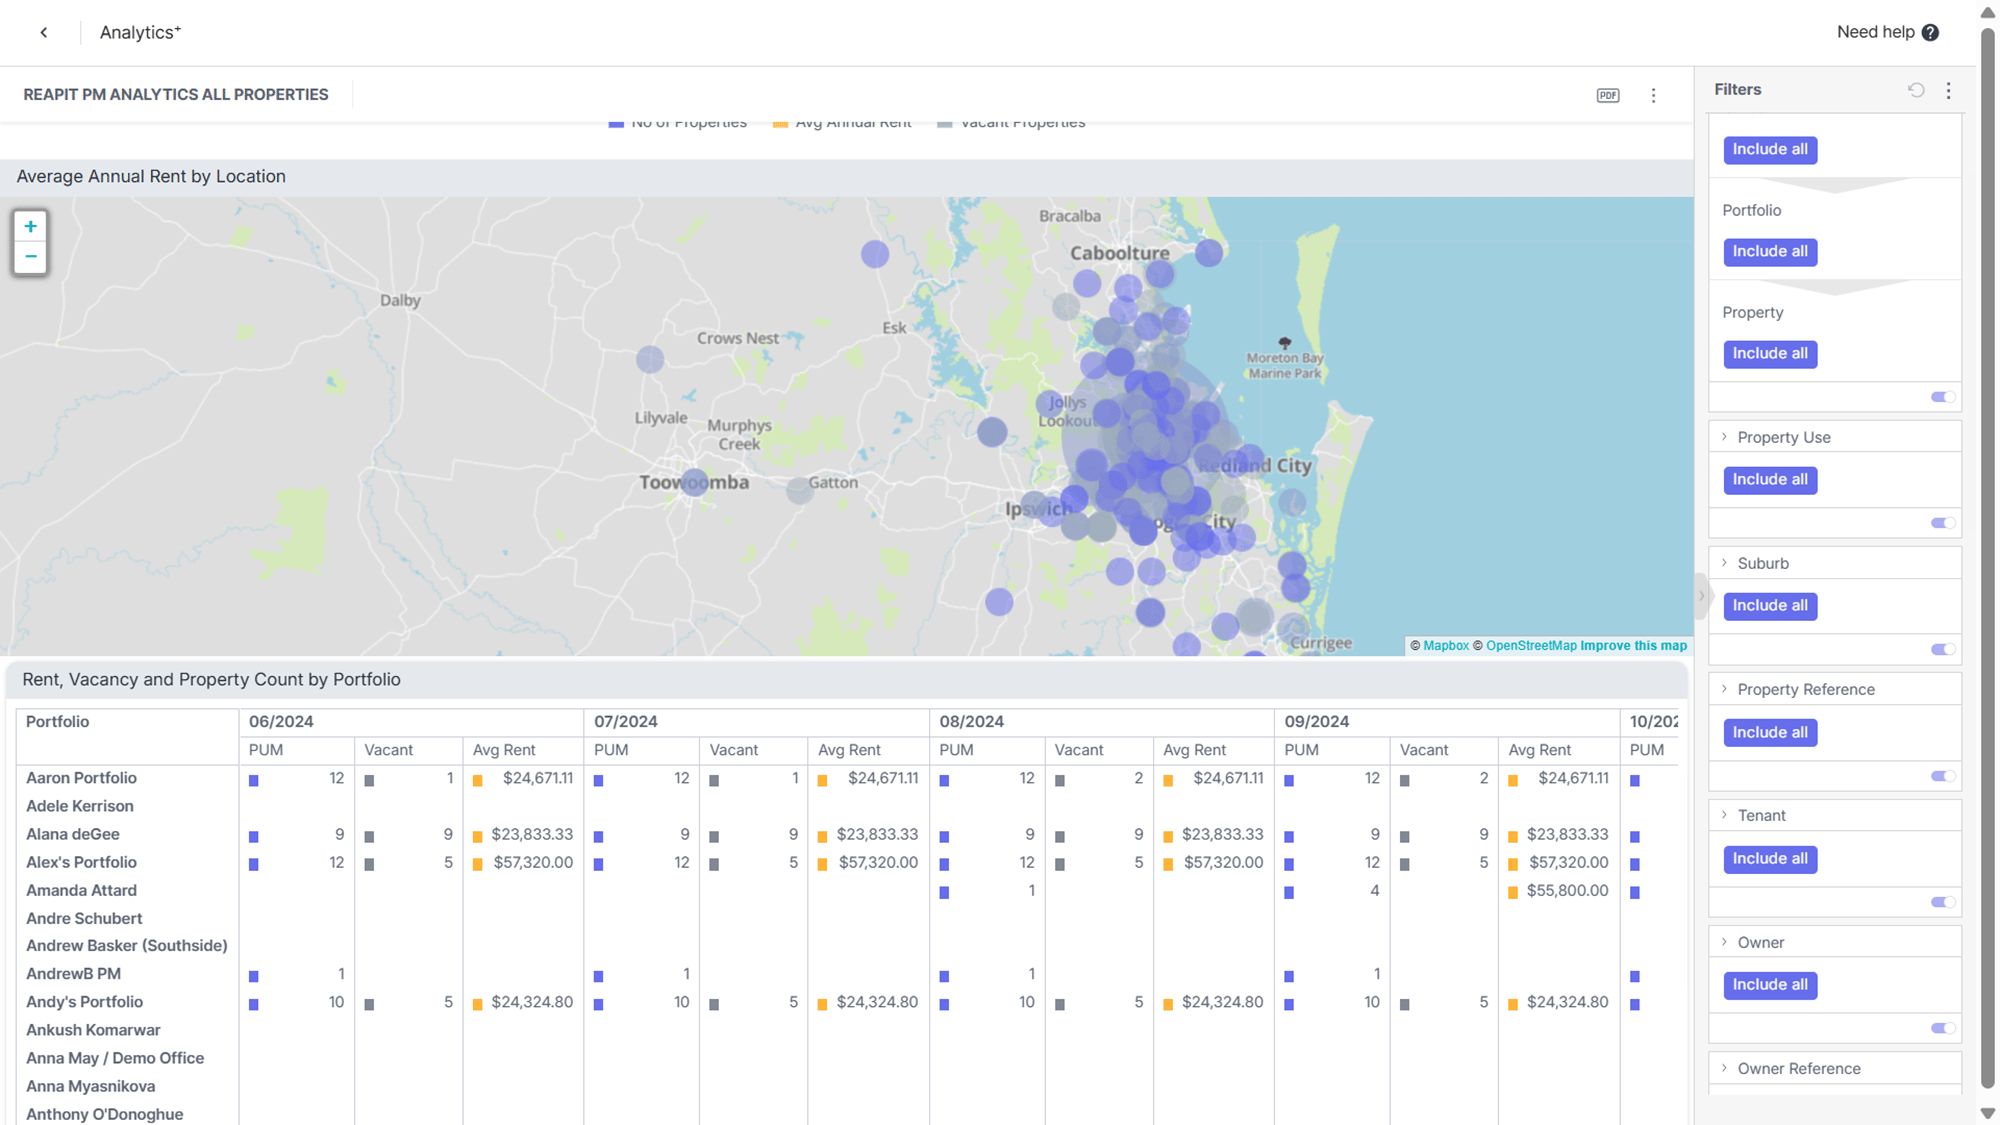
Maps can be zoomed in and out to look at location-specific data.
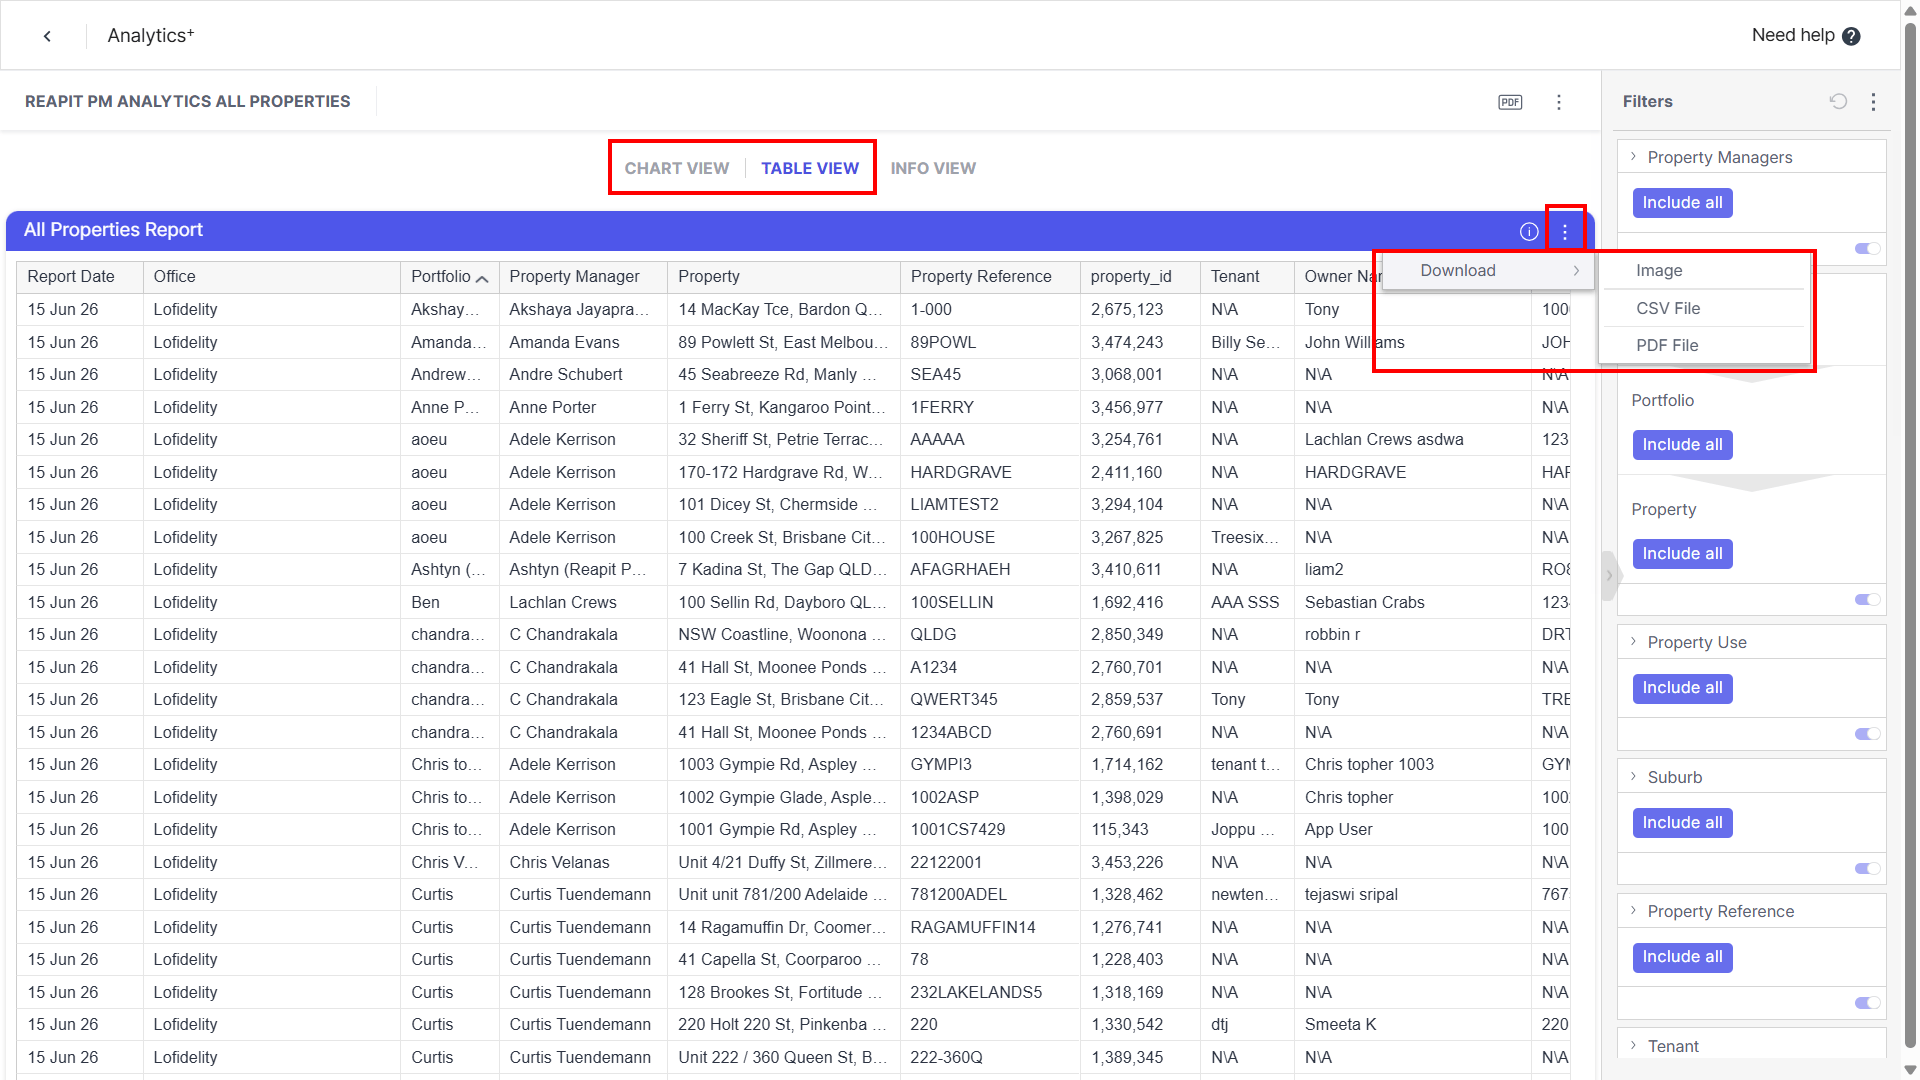
Flip between the Charts and Table options. The Table option can be used to export data. Select Download to see available formats.
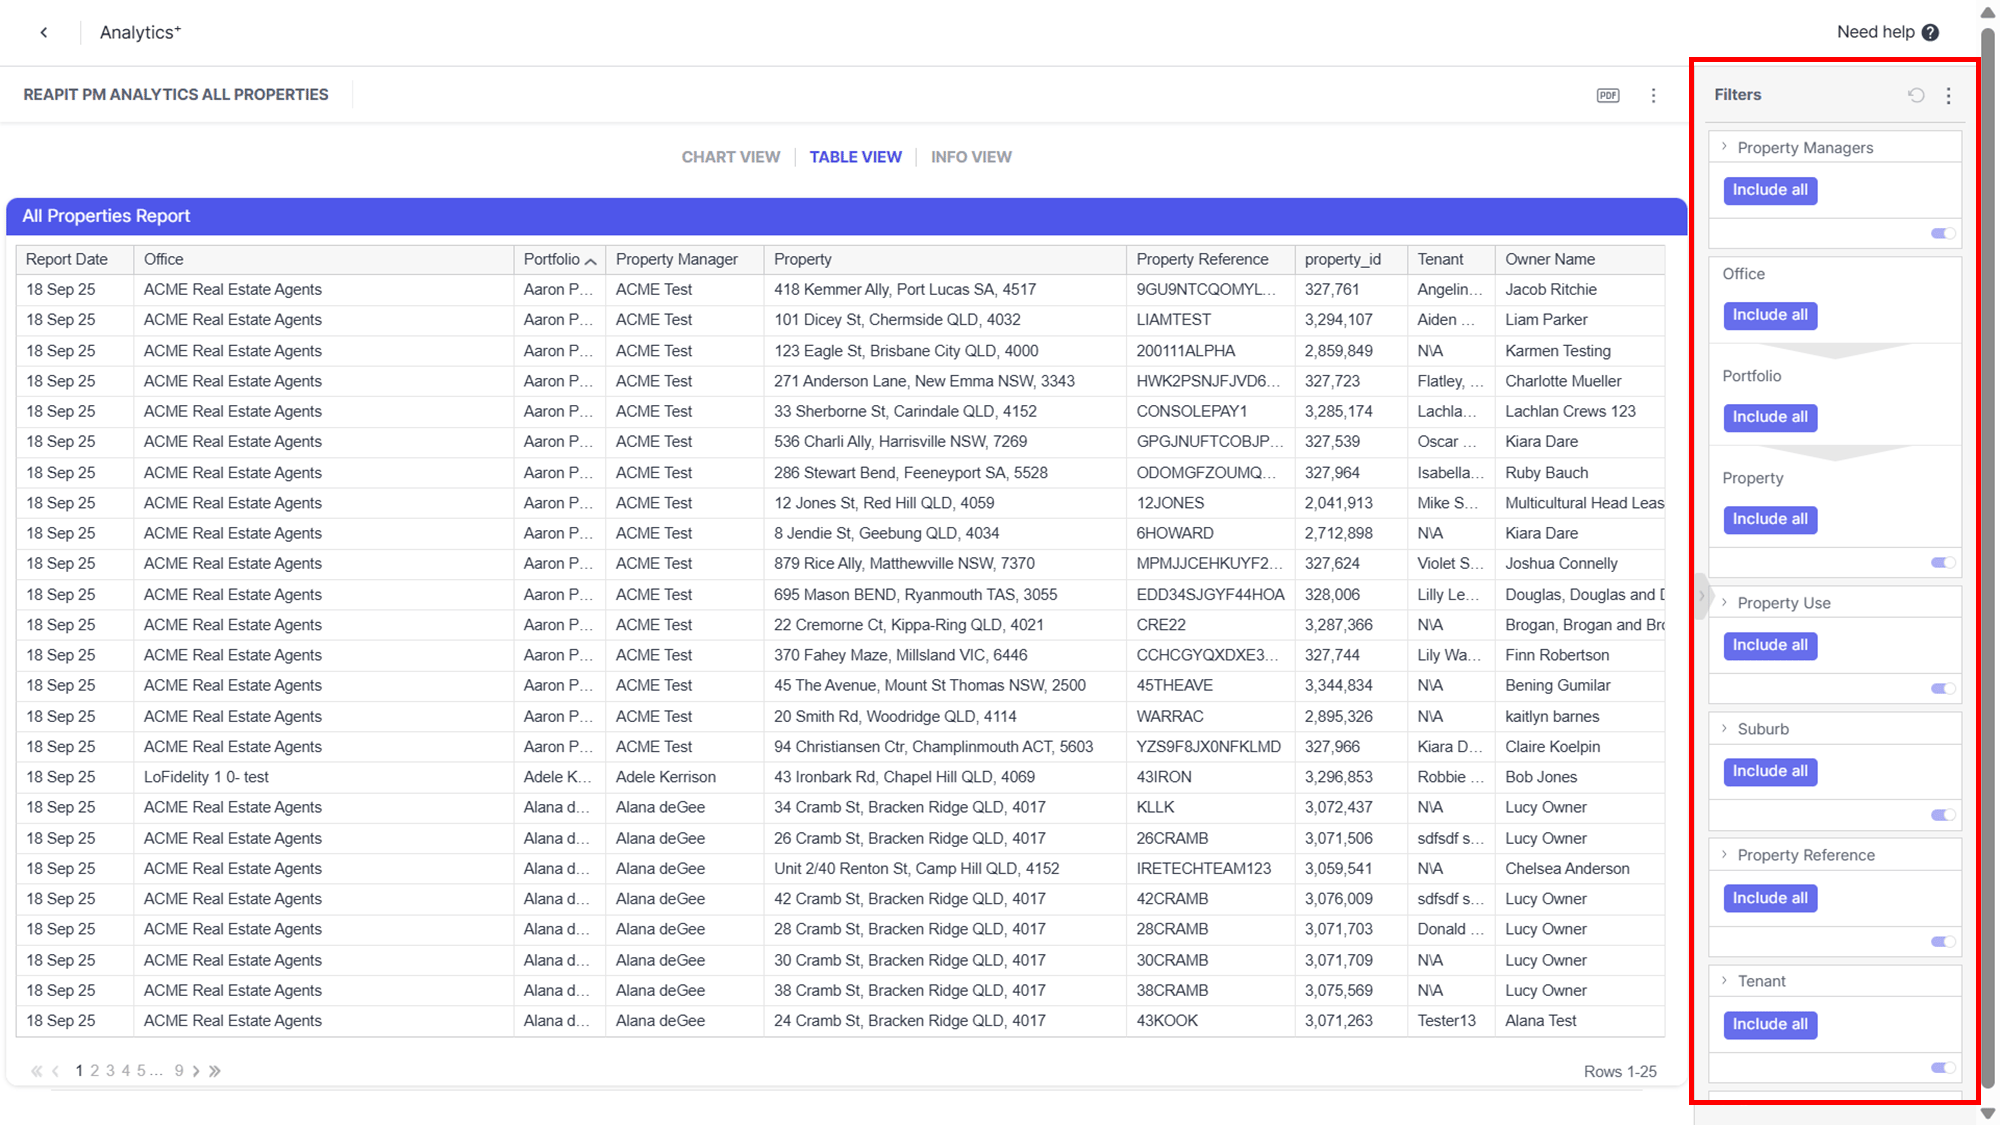
Filters are located to the right-hand side of the screen. This will display the default filters applied to this report.
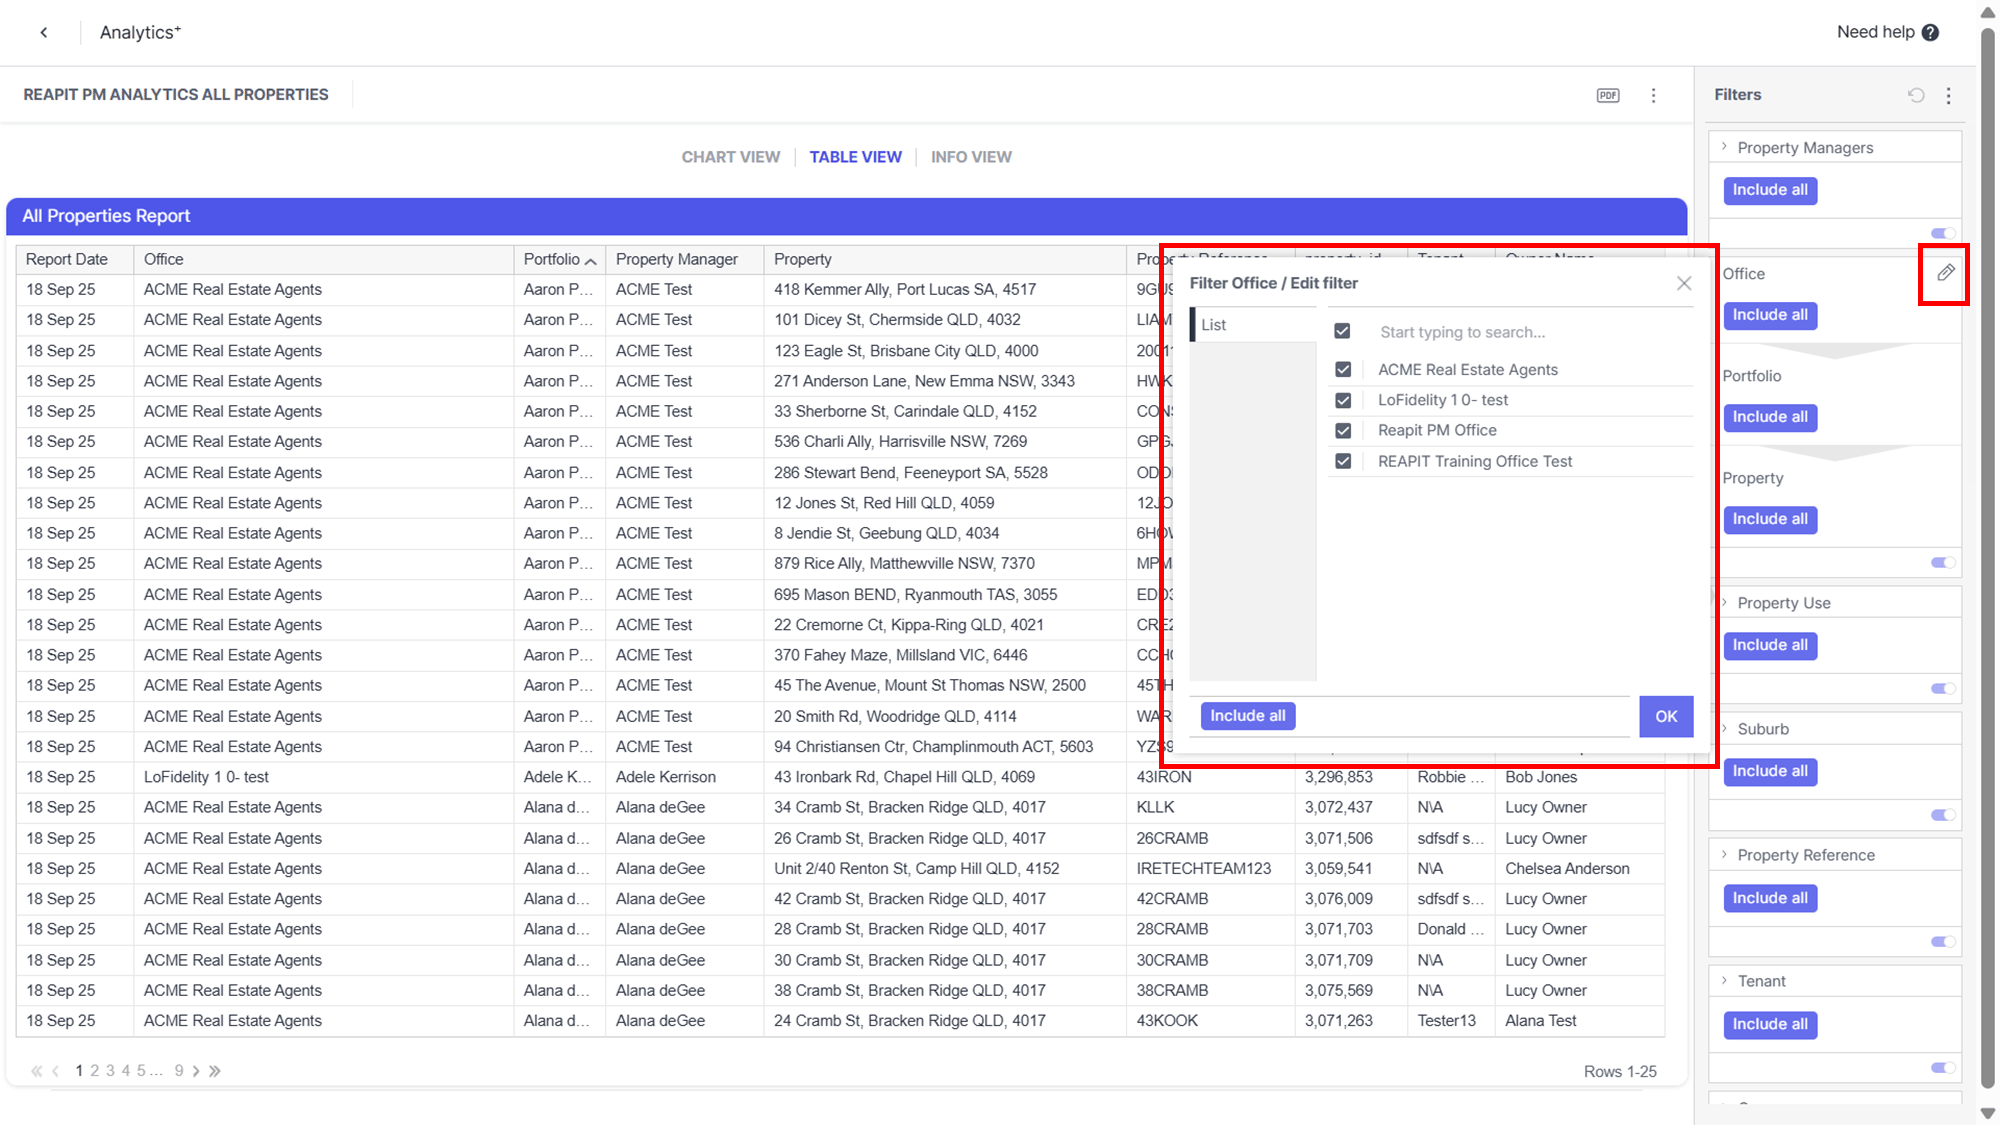
Toggled filters are applied, to edit any filter hover over the filter and click the pencil icon. A list of available filters will appear, select and deselect via the check boxes and click OK.
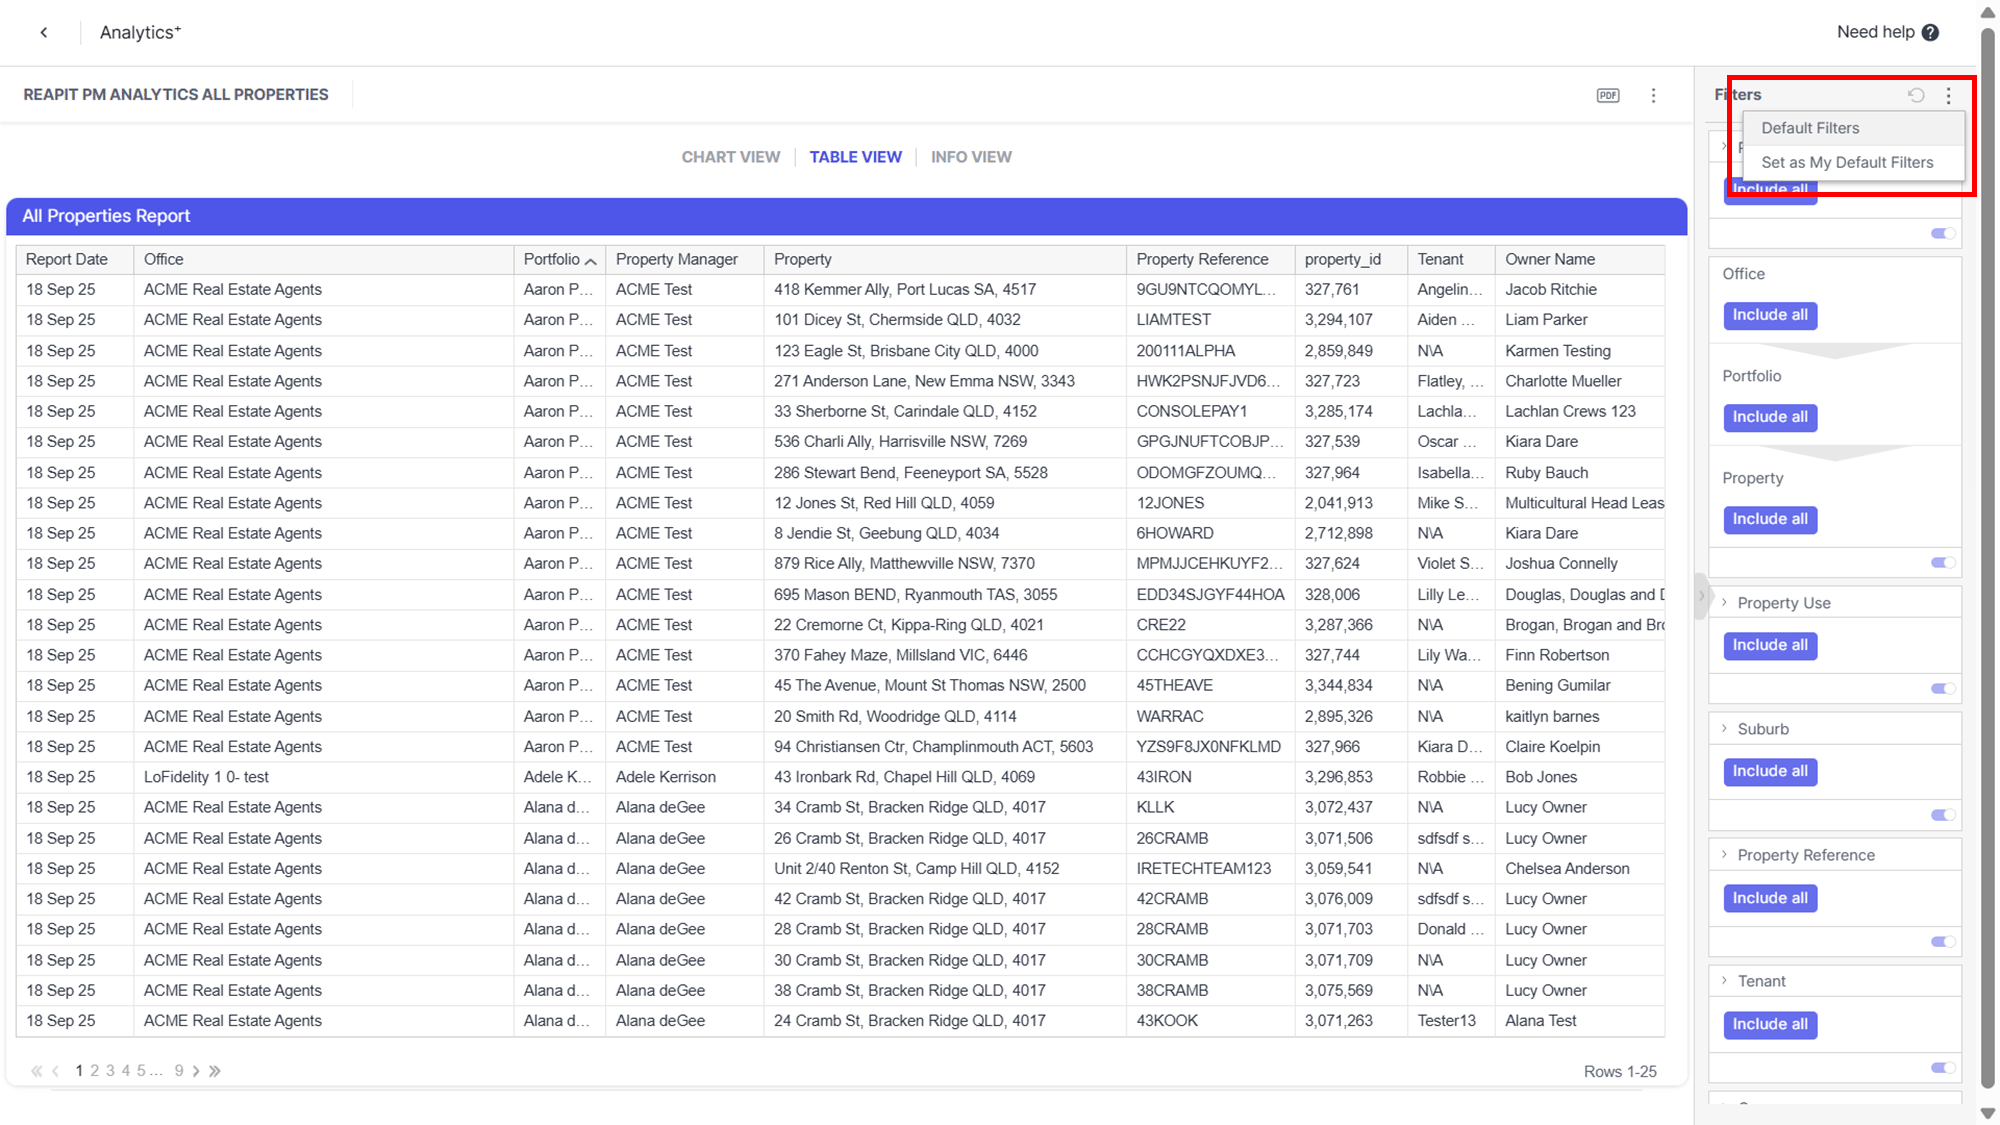
To set a filter as default click the 3-dots and choose Set as My Default Filters. This will then allow your to apply the filters easily when next accessing the report.
Interacting with Charts
Charts and KPIs are interactive. Scroll in and out on Map charts to zoom in, or right click to access further information.
Click on the bars in charts to filter by that dimension as opposed to using the filters on the side.
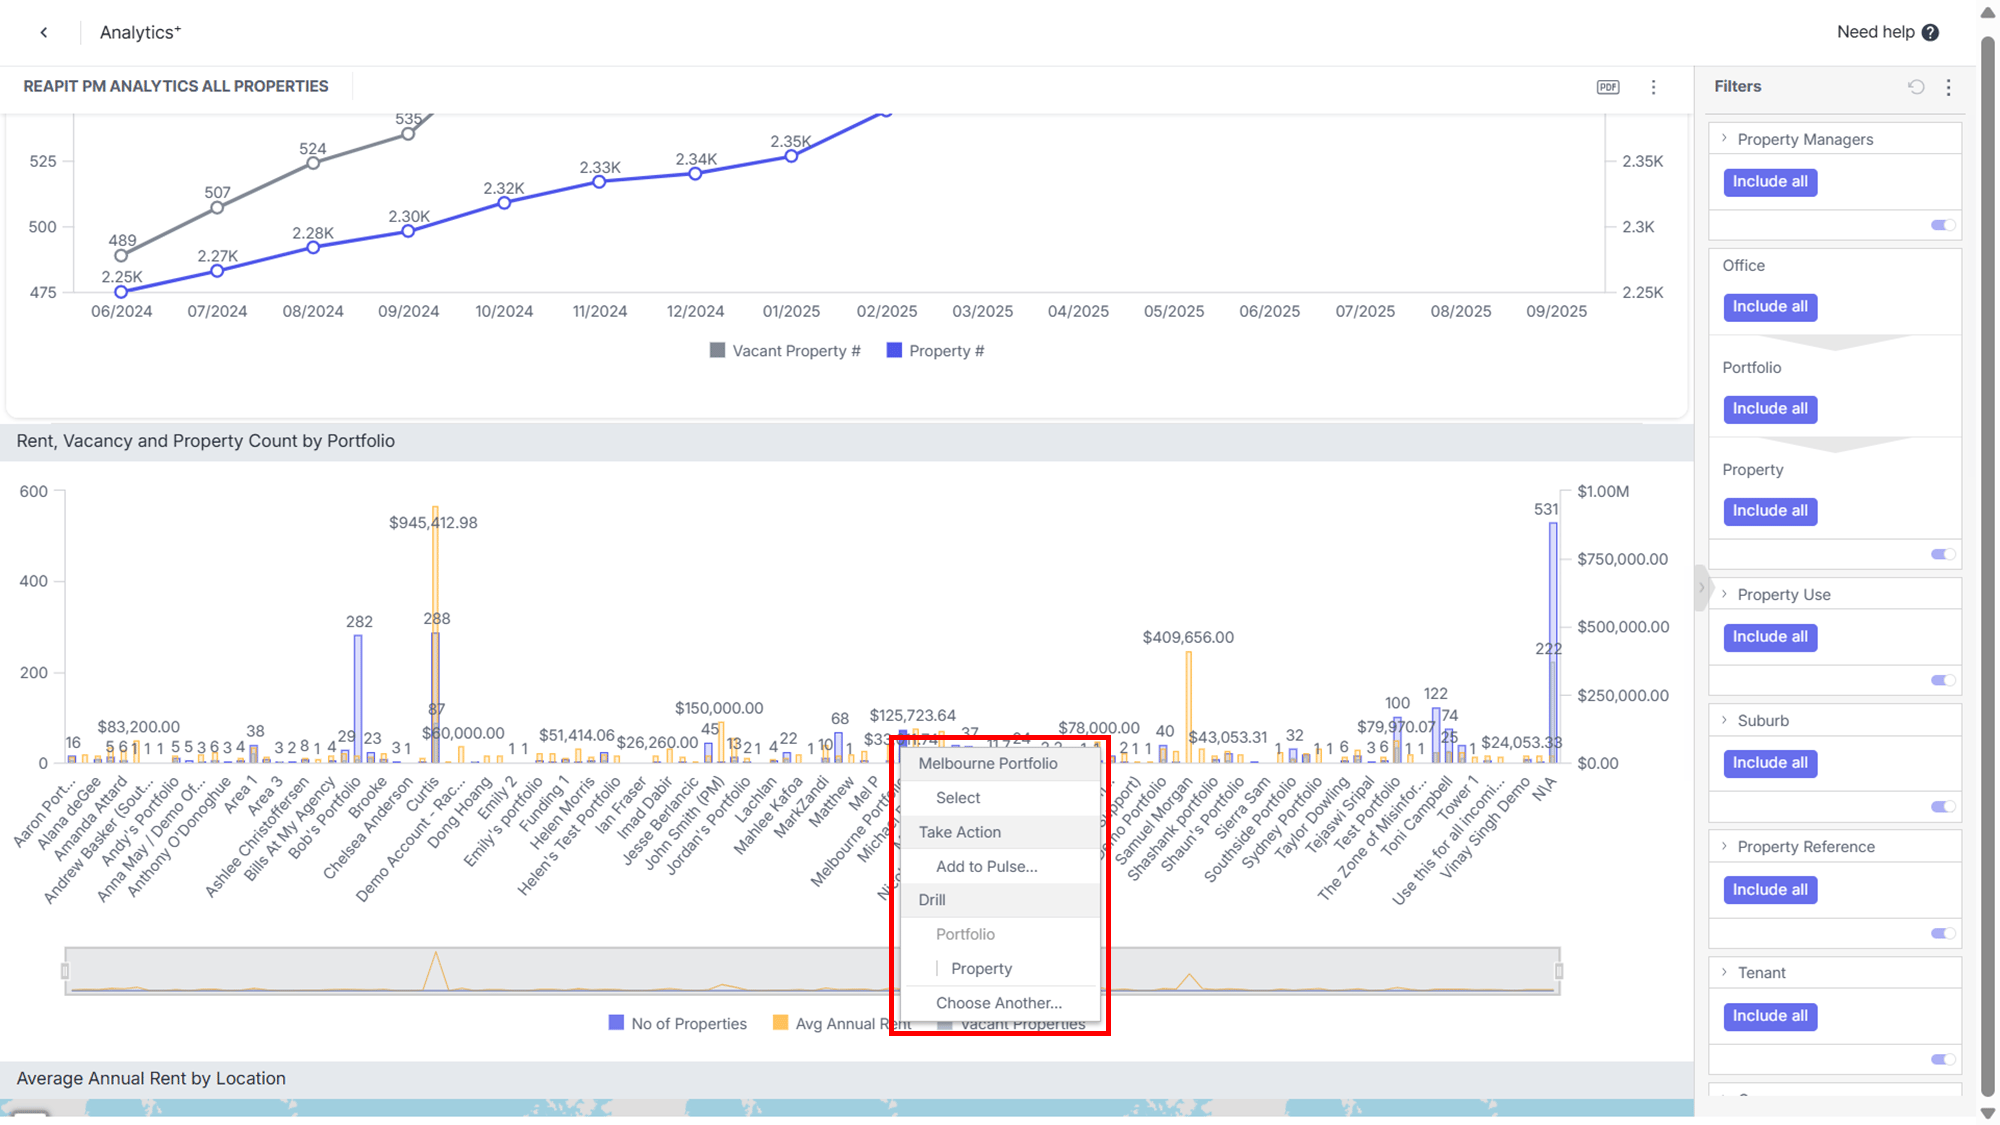
Right click on a bar chart to drill down into the child data or into the Property information.
Selections will be visible on the top right of the chart. Click the X to remove the drill down filter.
Adding a Forecast
Some of the charts by default include a forecast or this can be applied via the Analyse This button.
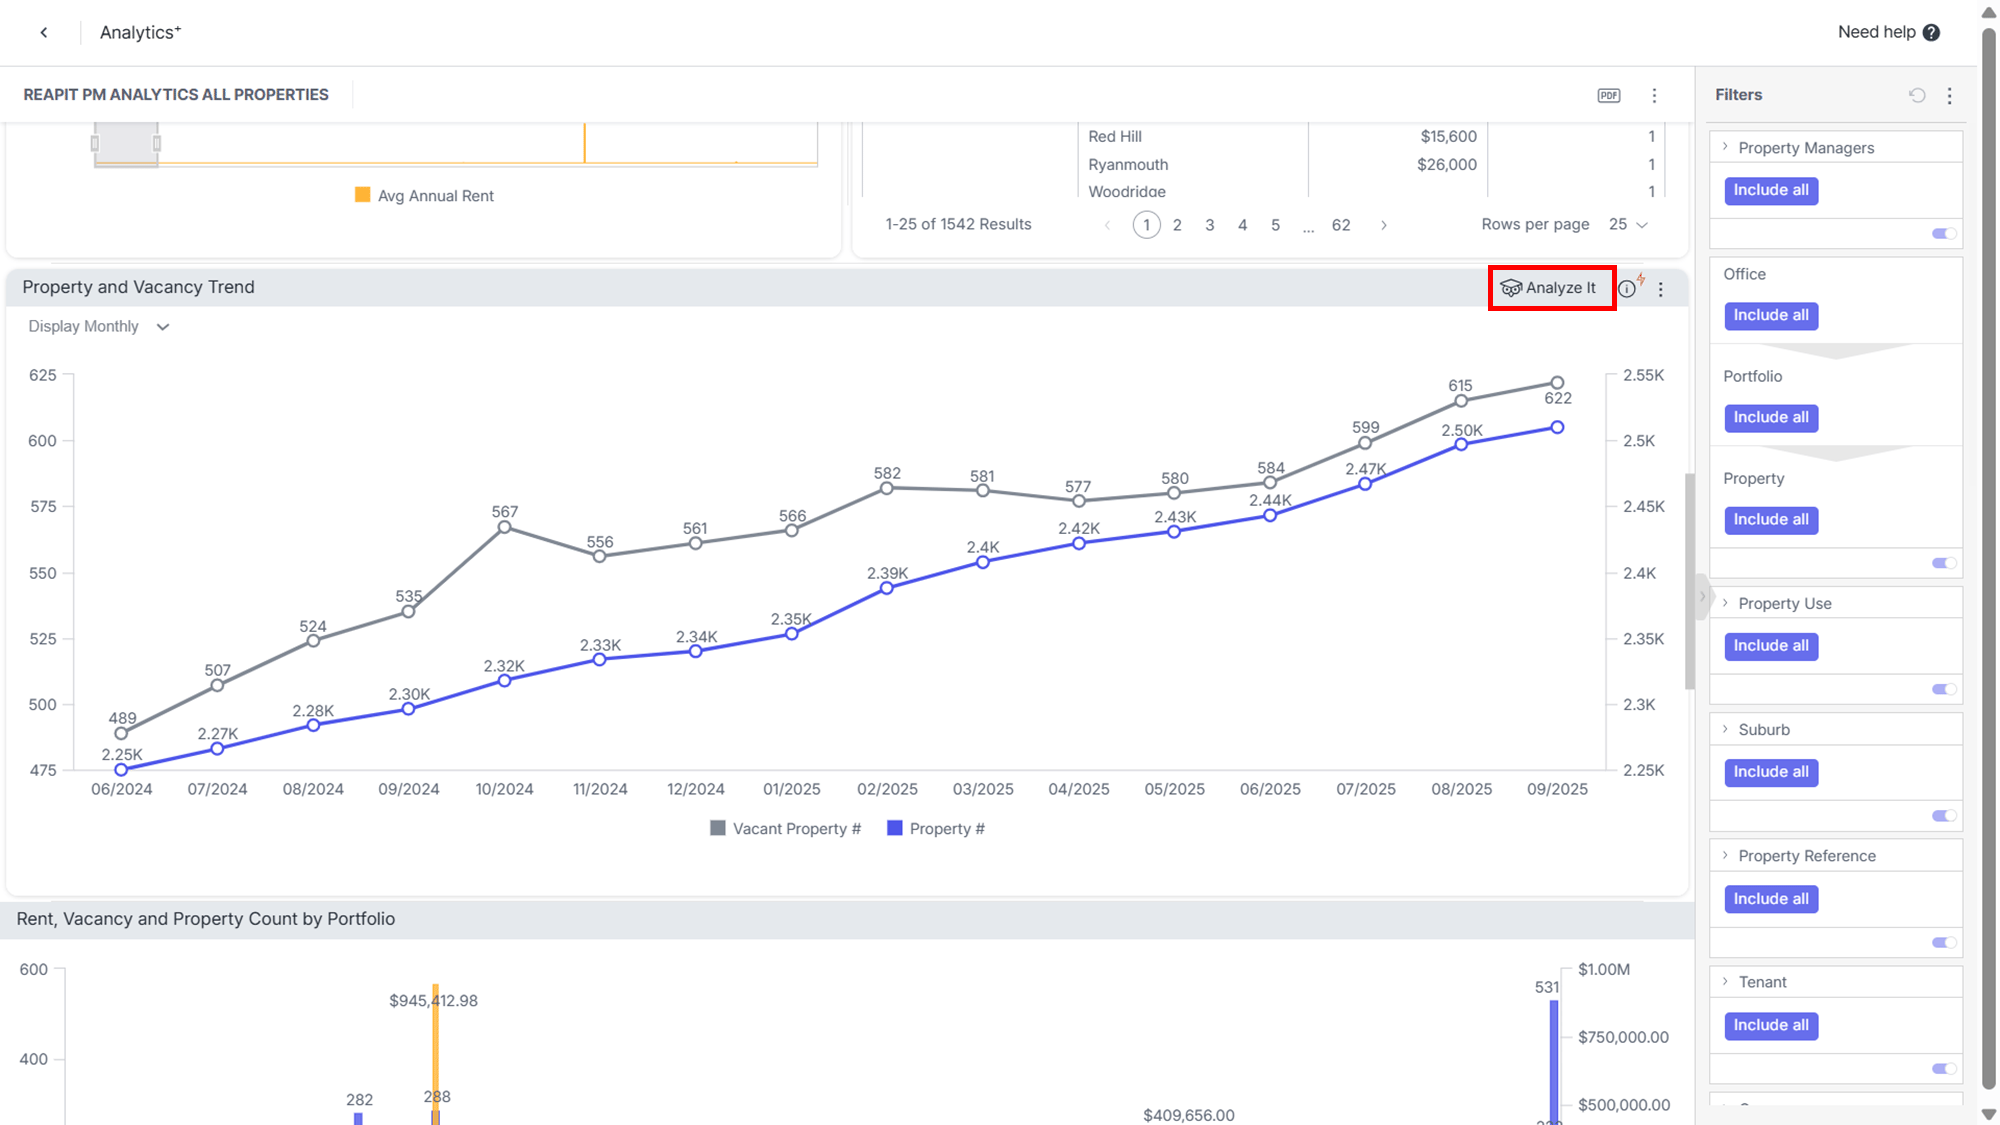
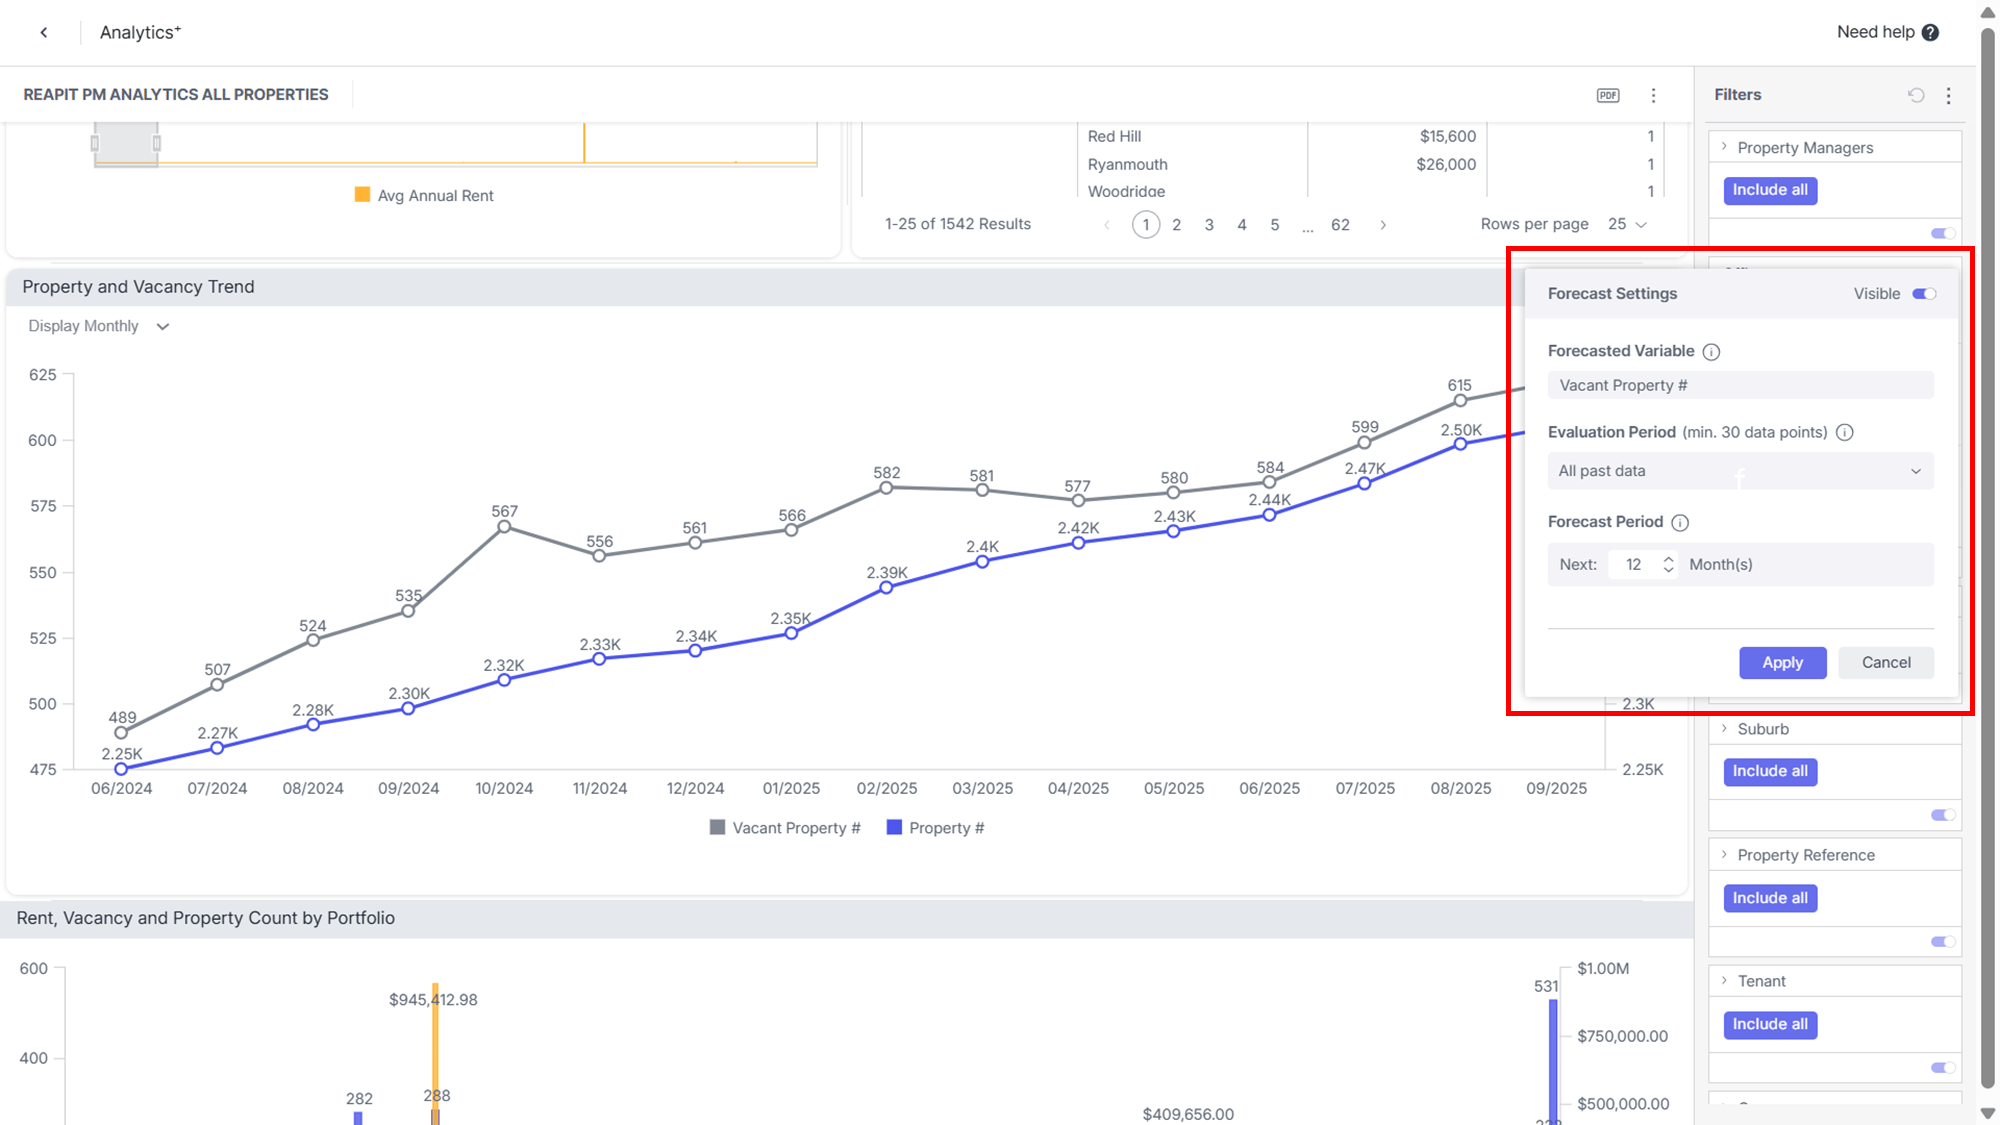
Click to view the Forecast Option which will give you a choice of each measure that is included in the chart. You can add a trend for each of these.
Once you select the measure you want to display a forecast of you are given the following set up screen as a small window on screen. From here you can select whether to make it visible by using the toggle top left, choose the data to base the forecast on and choose how long to forecast too.
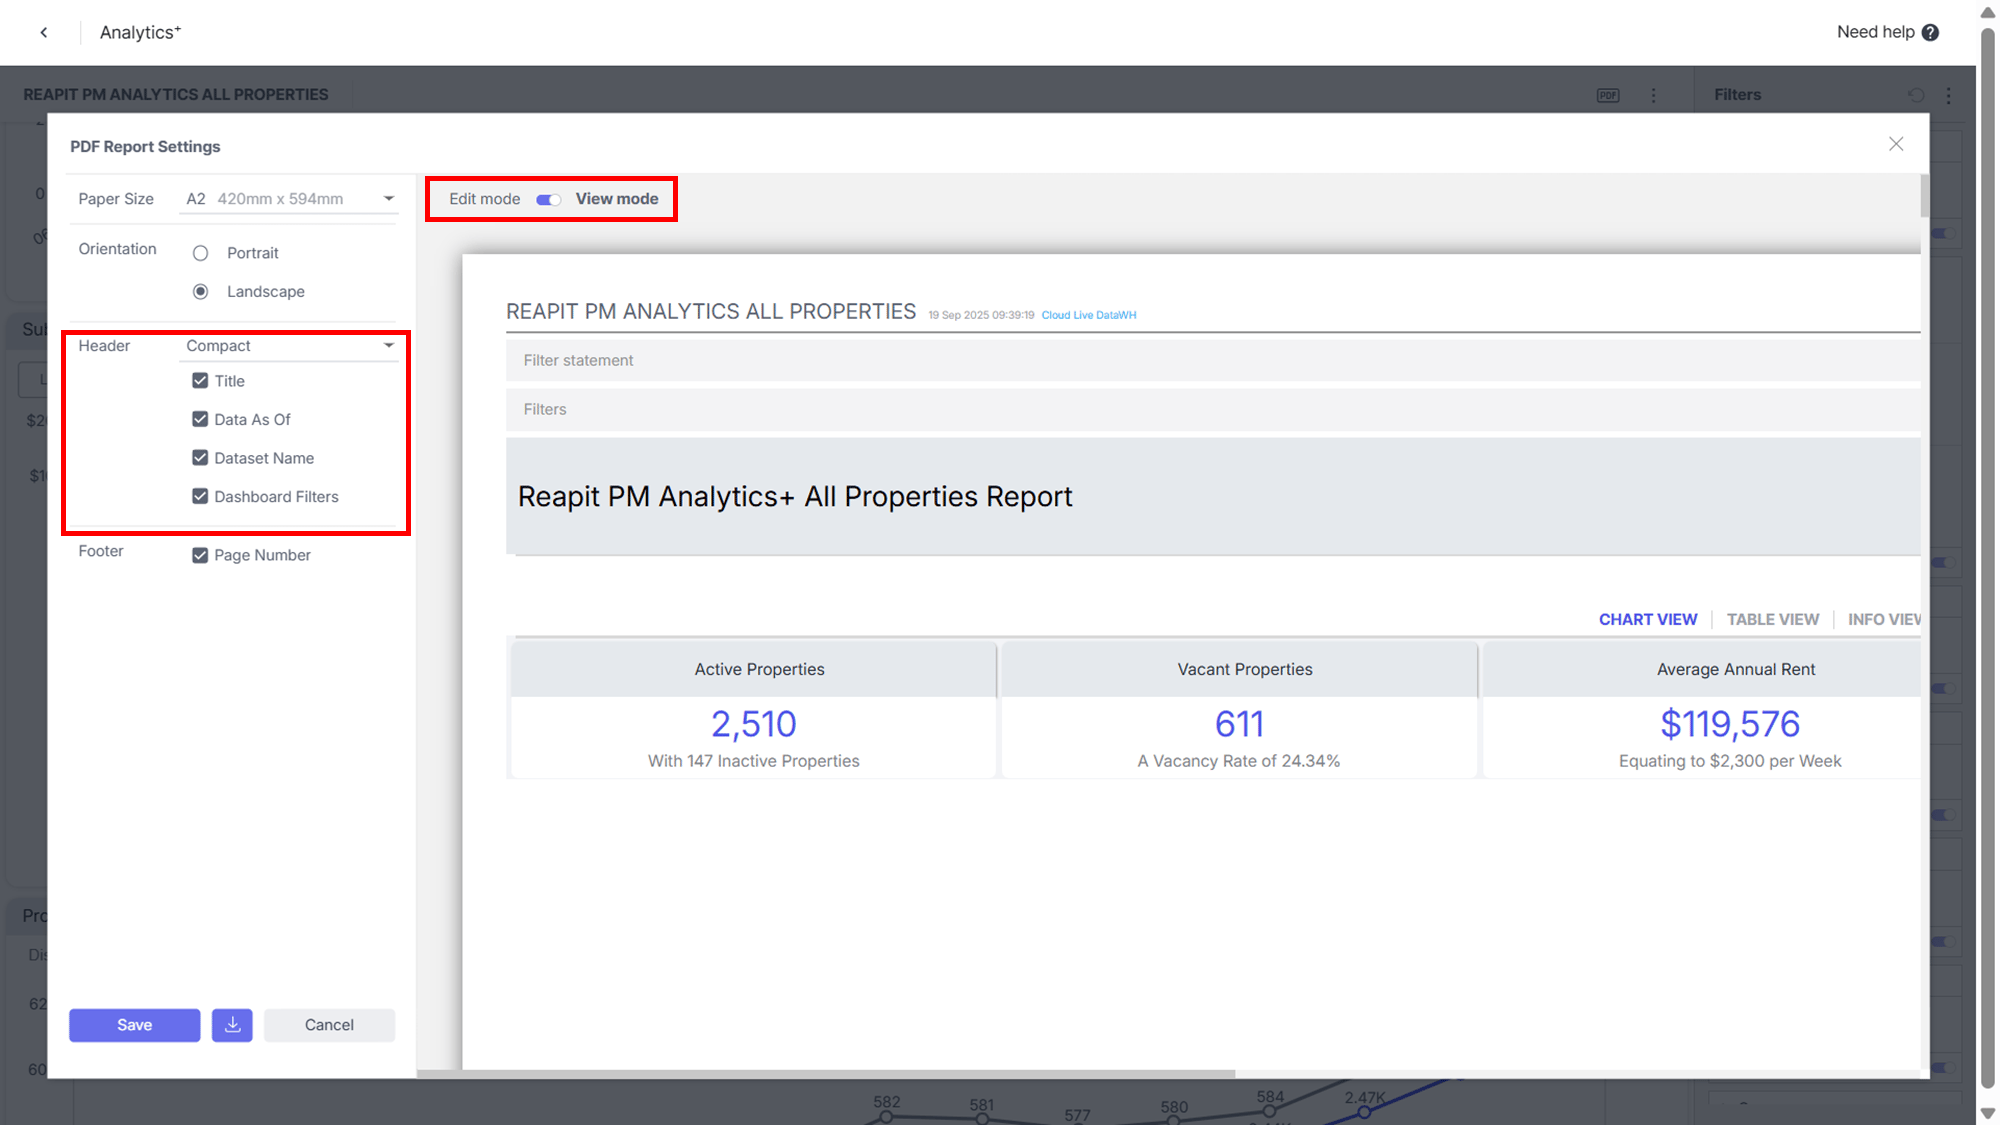
Export to PDF
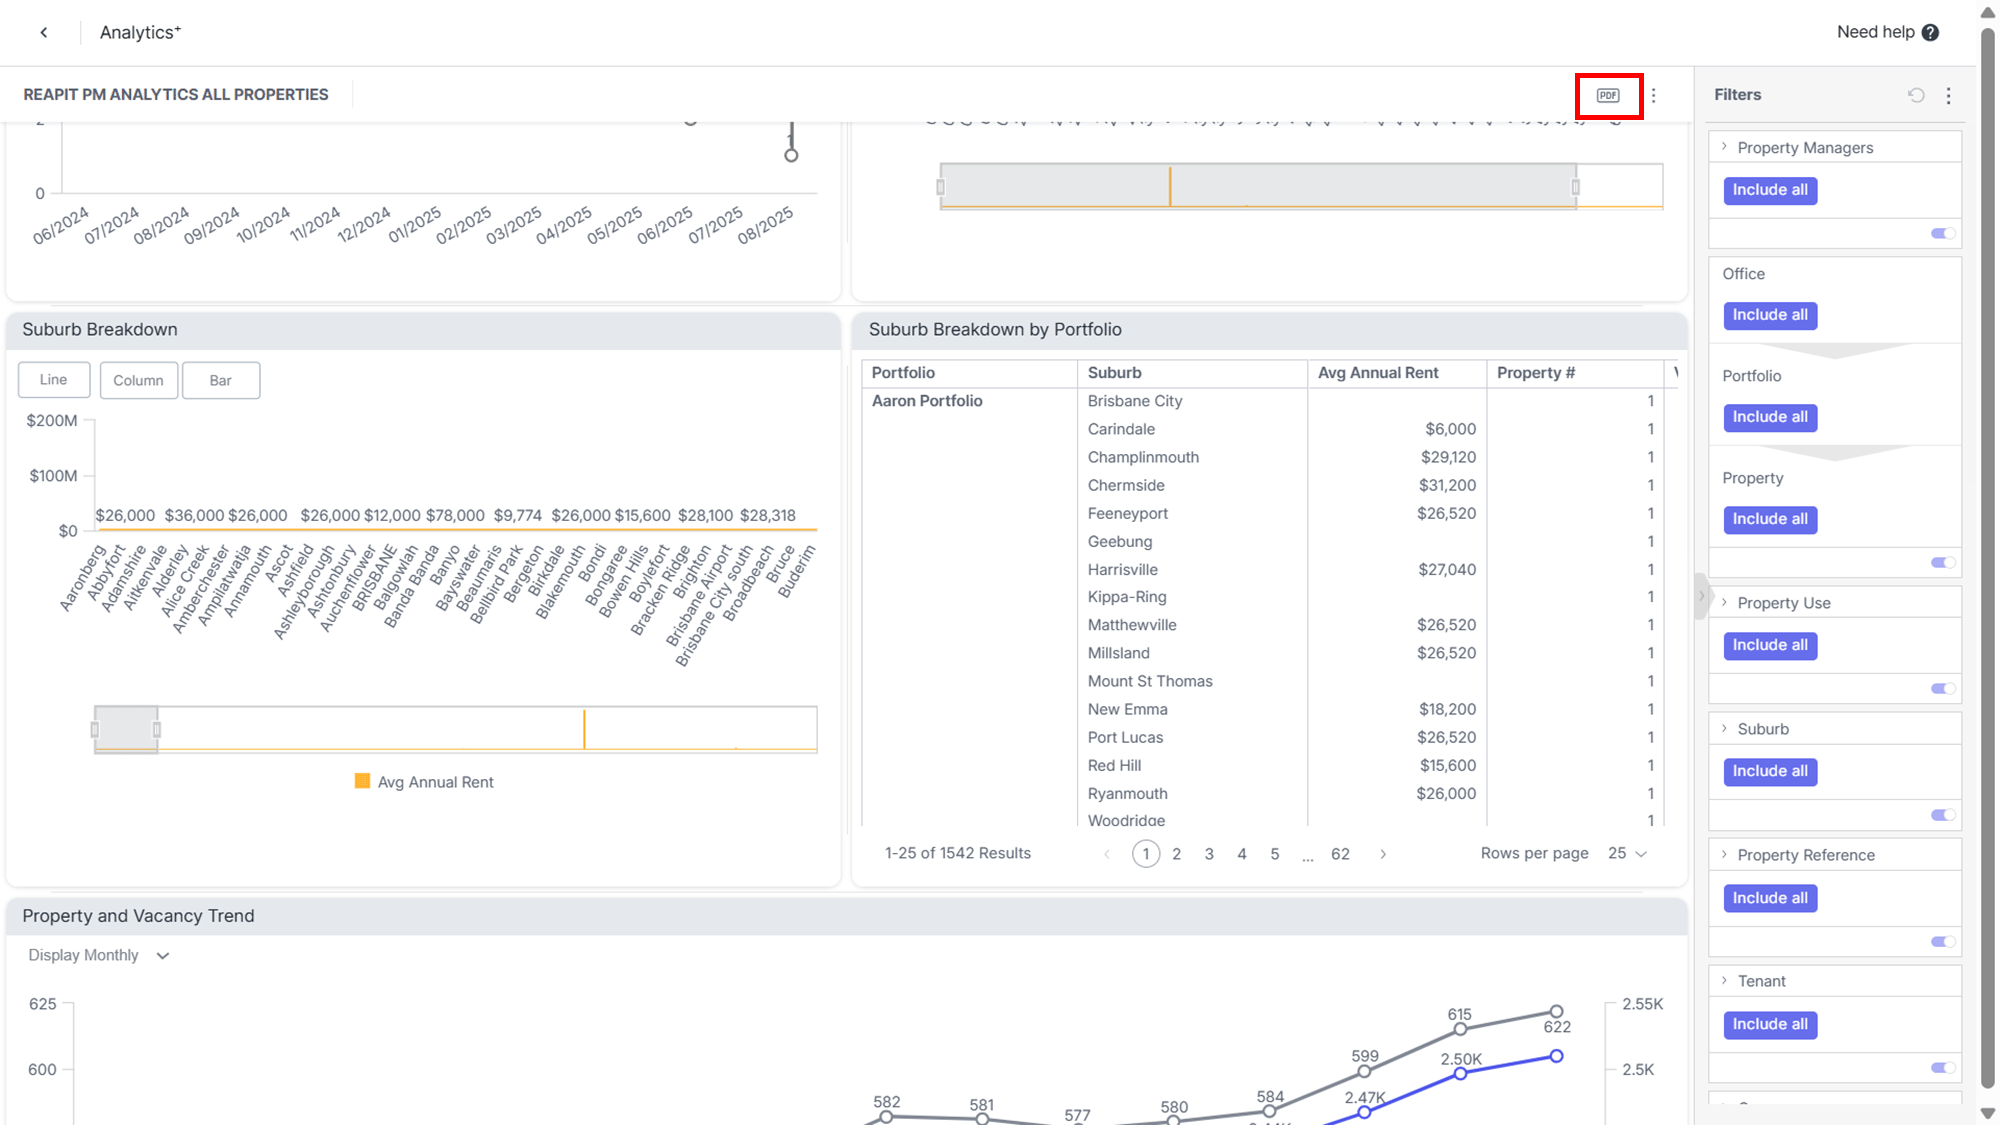
Click on the PDF button to export the board to PDF.
From within the print preview screen change the:
- Paper Size
- Orientation
- Header
- Footer
Various elements can be removed from the page such as data source or Title, these options are all available on the left hand side.
Clicking on the Edit Mode toggle at the top of the screen will allow you to resize the widgets.
Download the report as PDF or click Save which will save the layout changes you have made.