'%20d='M0%208a8%208%200%200%201%208-8h24a8%208%200%200%201%208%208v24a8%208%200%200%201-8%208H8a8%208%200%200%201-8-8V8Z'/%3e%3cpath%20fill='%23fff'%20d='M8.375%2013v14L20.5%2034l12.124-7v-7.737l-1.687-.975-2.806-1.62-1.082-.624v4.83l-.002%204.83H13.95V16.07l3.275-1.89%202.192-1.265%201.082-.625%203.275%201.877%202.192%201.256%201.083.62V9.782L20.5%206%208.376%2013Z'/%3e%3cdefs%3e%3clinearGradient%20id='reapit-pm__a'%20x1='20.702'%20x2='20.702'%20y1='.351'%20y2='31.228'%20gradientUnits='userSpaceOnUse'%3e%3cstop%20stop-color='%235573FD'/%3e%3cstop%20offset='.575'%20stop-color='%234E56EA'/%3e%3c/linearGradient%3e%3c/defs%3e%3c/svg%3e)
Analyticsᐩ Reports
The Analyticsᐩ Reports in Reapit PM offer essential metrics, detailed information, interactive dashboards, and options for deeper analysis.
The Analyticsᐩ Reports offer essential metrics, detailed information, interactive dashboards, and options for deeper analysis. These reports are available for export to Excel or can be printed using a customisable PDF tool.
Additionally, the analytics suite includes standard reporting, with extra reports accessible to Reapit PM Premium users.
This article encompasses the following key reports:
- All Properties Report
- Inspections Report
- Lease Renewals Report
- Business KPI (Key Performance Indicator) Report
- Property Manager KPI Report
- Business Growth Report
- Data Cleanse Report
- My Monthly Report
- Referrals
- Commercial Tenancy Schedule Report
- Yardstick Report
- Neighbourhood Report
- Reapit Activity Planner
- Analytics + Central
- Custom Data Report (Enterprise)
- Additional Information
- Schedule Reporting
The following is a detailed breakdown of these essential reports and dashboards, complete with Key Performance Indicators (KPIs) and available charts.
All Properties Report
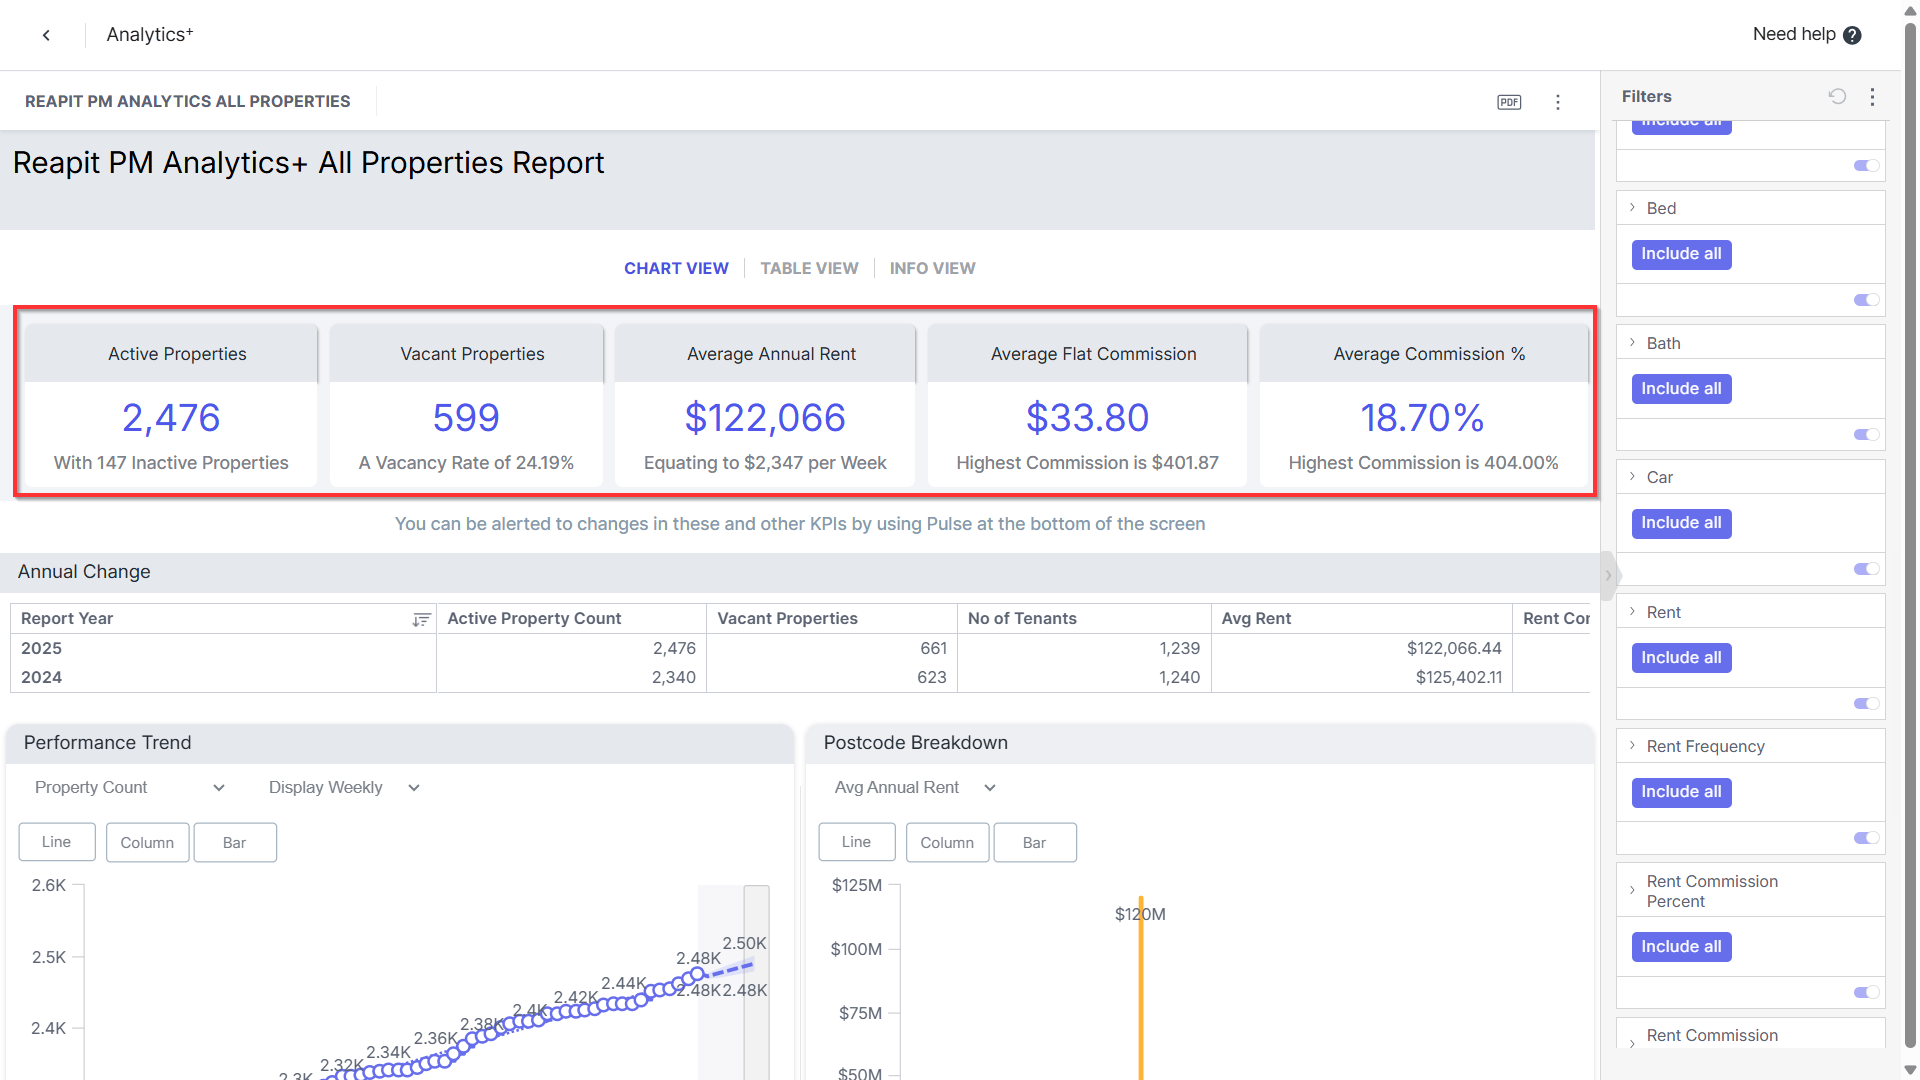
All Properties Report KPIs:
- Active Property Count
- Vacant Properties
- Avg Annual Rent
- Avg Flat Fee Commission
- Avg Commission %
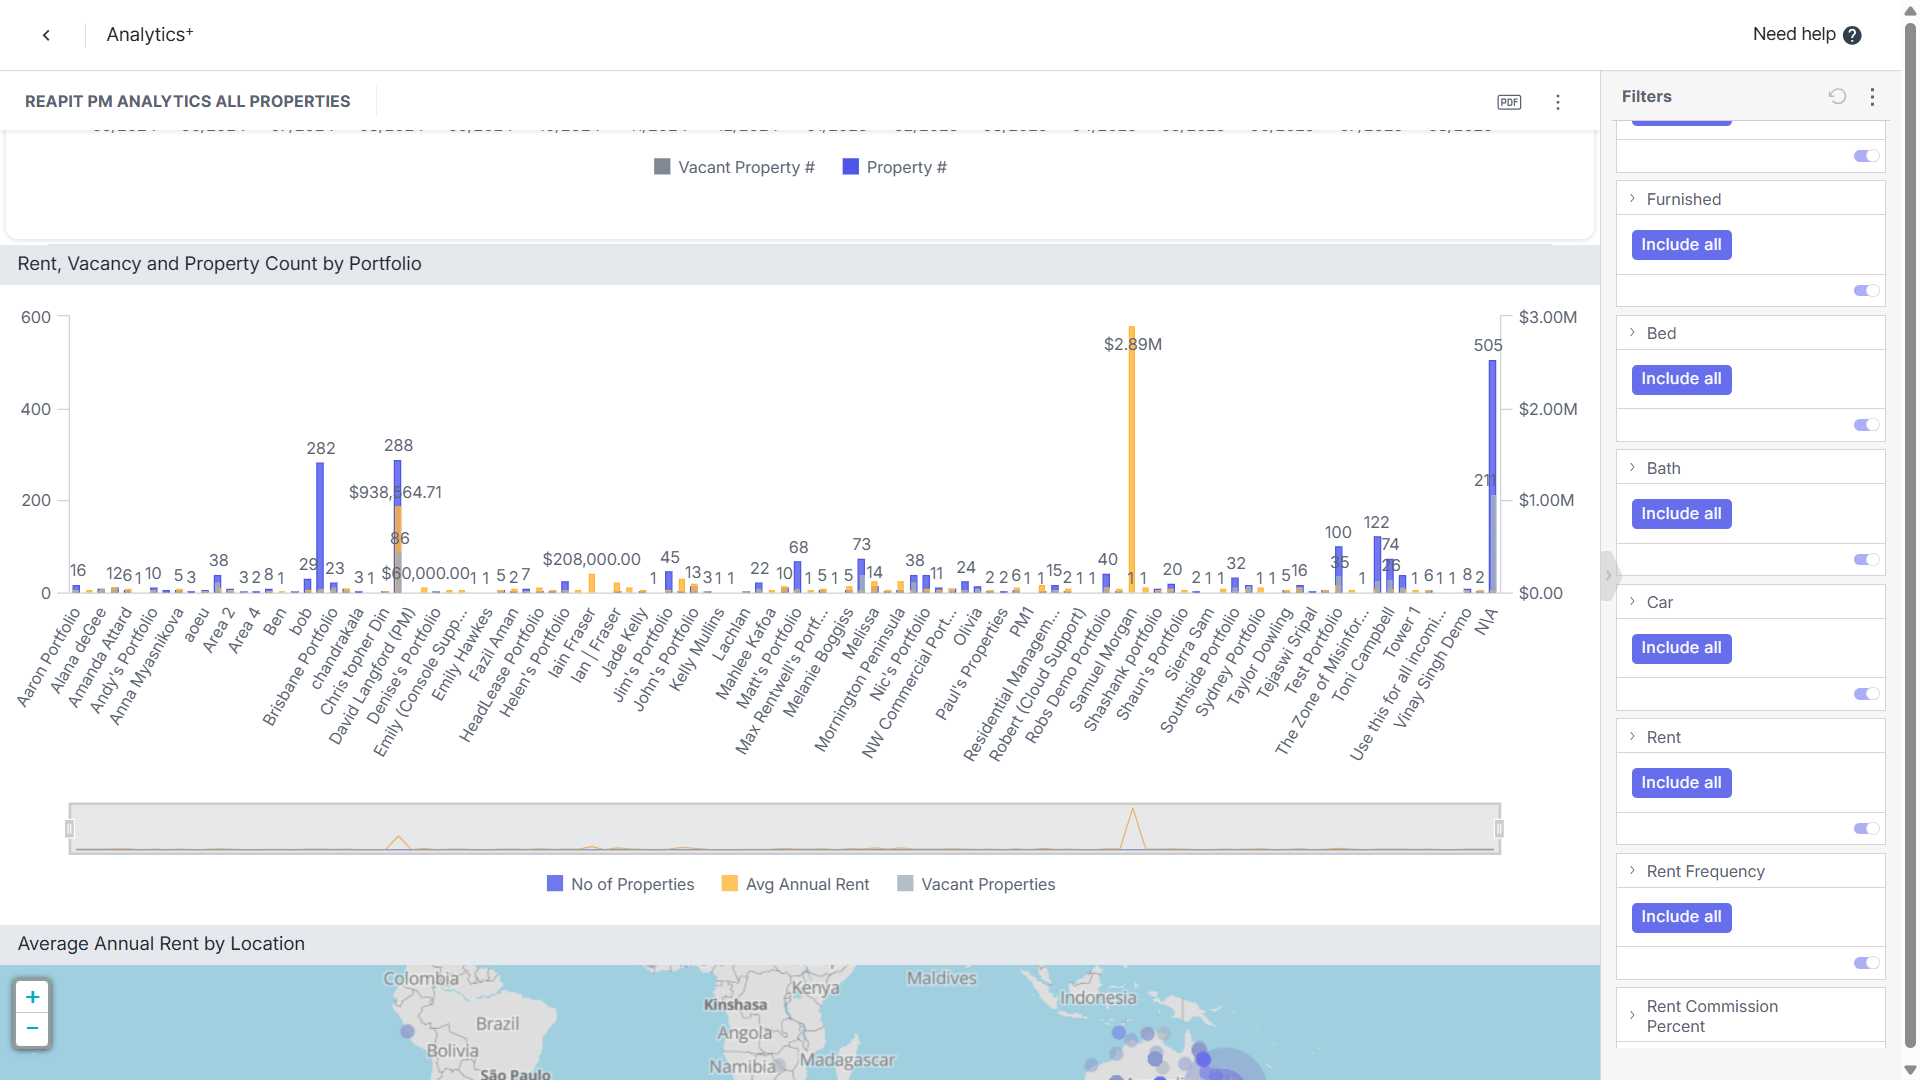
All Properties Report Charts
- Property Count, Vacancies and Avg Annual Rent By Portfolio
- Avg Annual Rent by Location
- Portfolio Rent, Vacancies & Avg Rent
- Properties By Bedroom #And Avg Rent
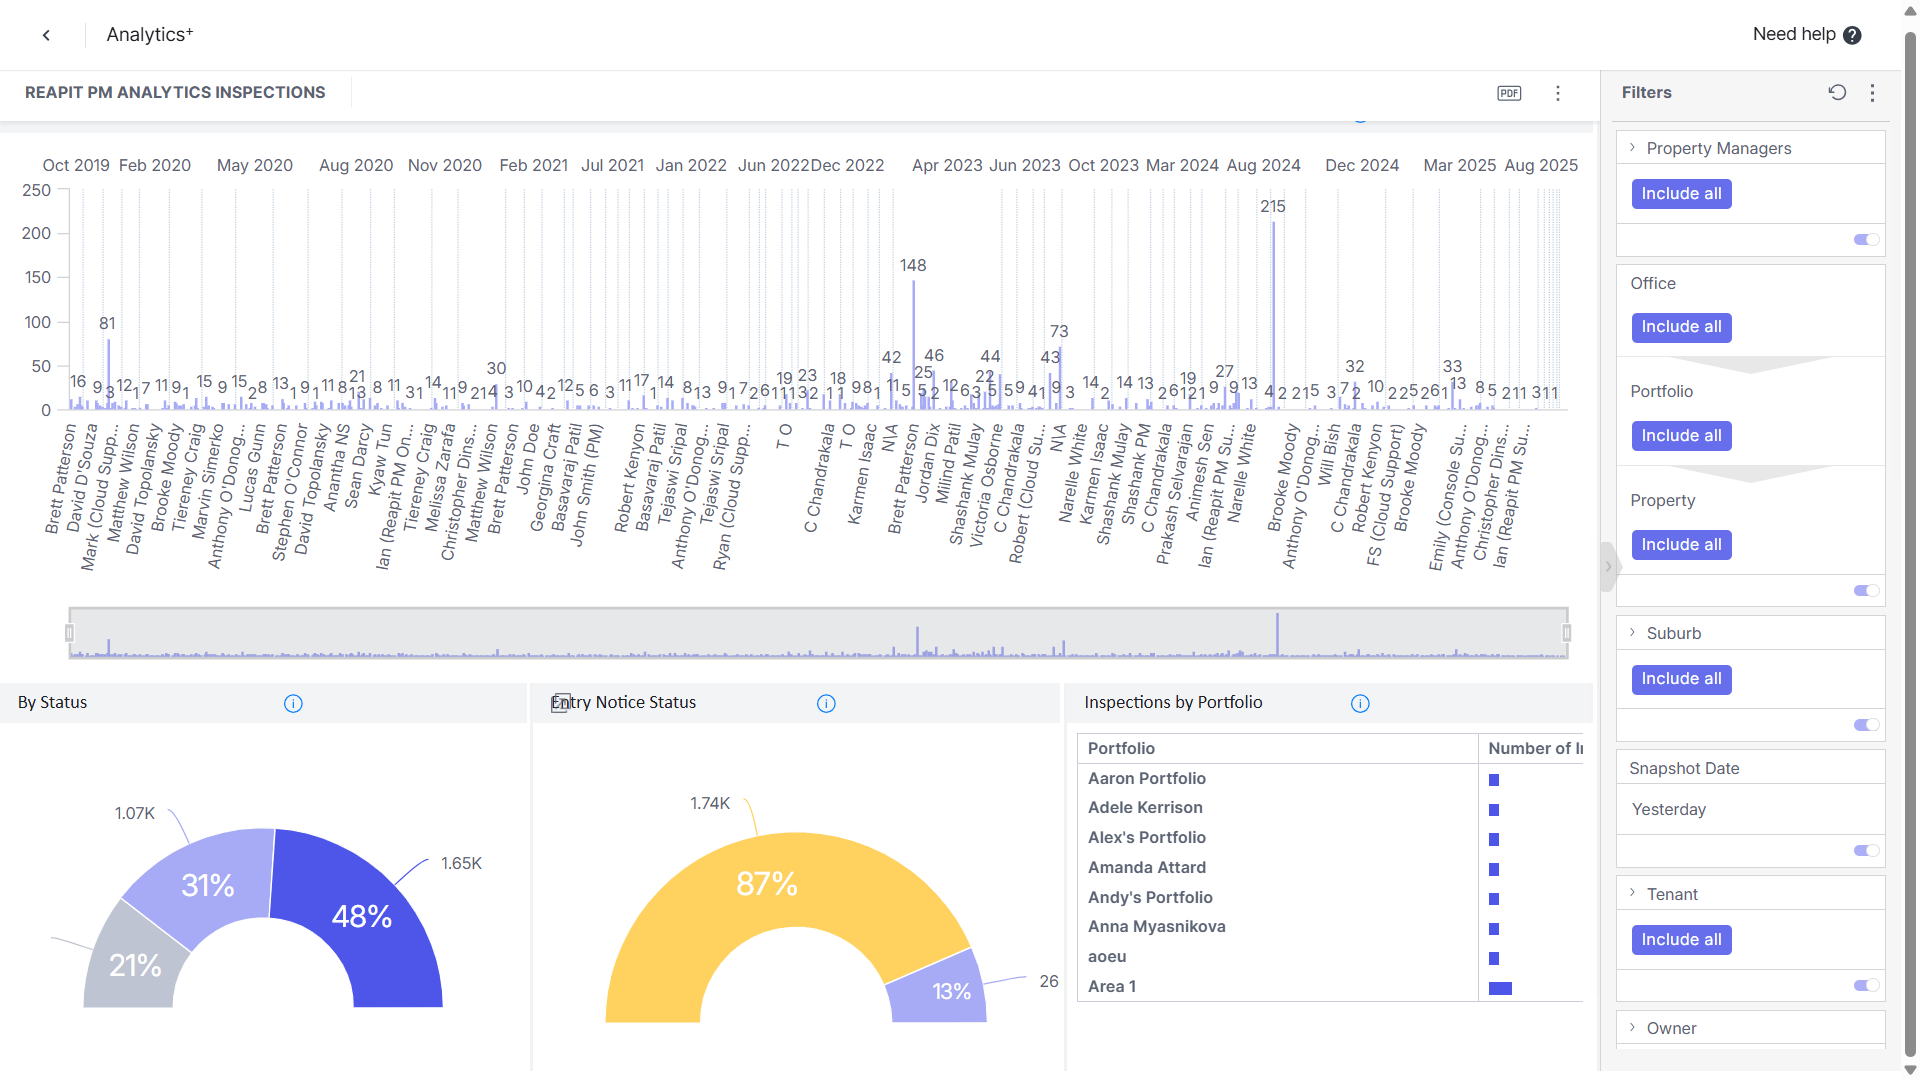
Inspections Report
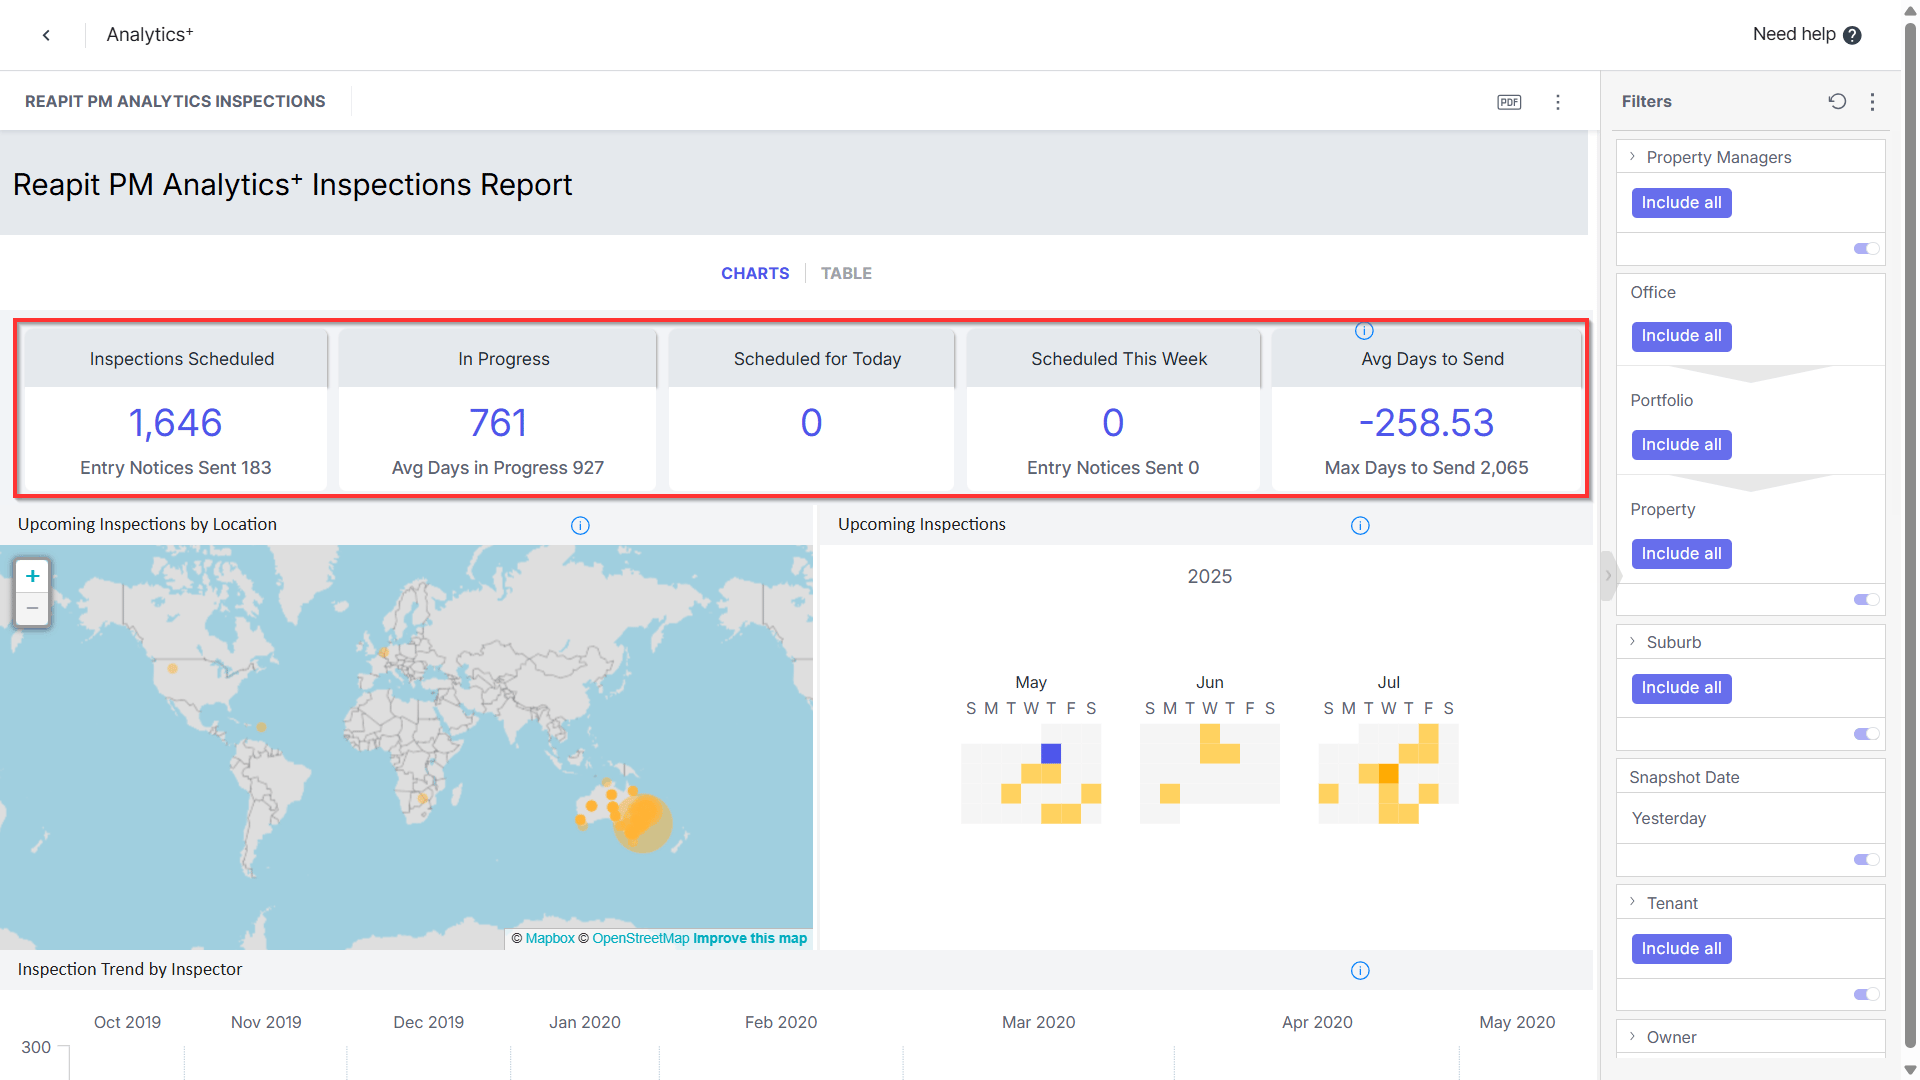
Inspections Report KPIs:
- In Progress
- Scheduled
- Today
- This Week
- Days to Send
Inspections Report Charts:
- Upcoming Inspections by Area
- Upcoming Inspections by Date
- Inspections by Portfolio
- Inspection # Trend
- Inspections by Status
- Inspections by Inspector
- Entry Notice Status
Lease Renewals Report
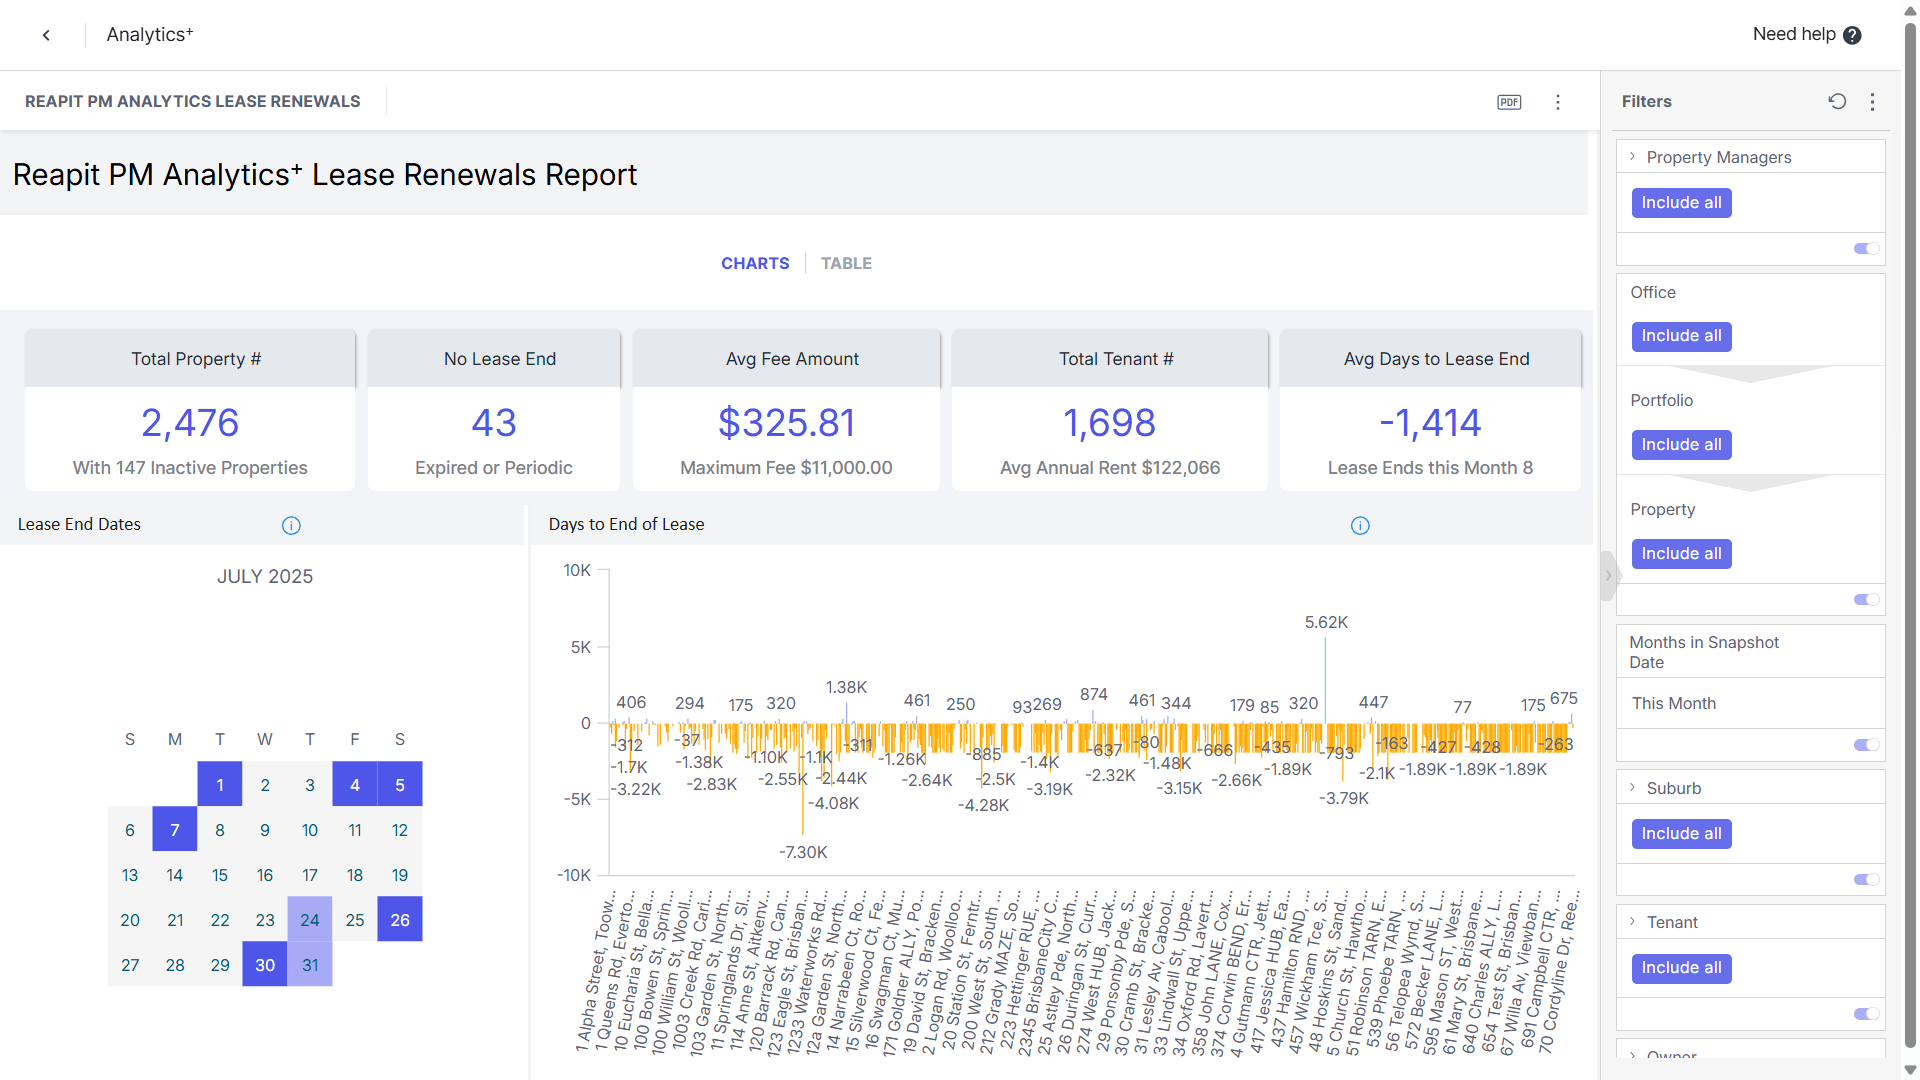
Lease Renewals Report KPIs/ Report Charts:
- Total Properties
- Total Owners
- Total Tenants
- Avg Days to Lease End
- Recommended Rent Variance
- The below dashboards are available on the Premium Subscription Only.
Business KPI Dashboard
Business KPI Dashboard KPIs:
- Active Property Number
- Average Annual Rent YTD
- AAMI
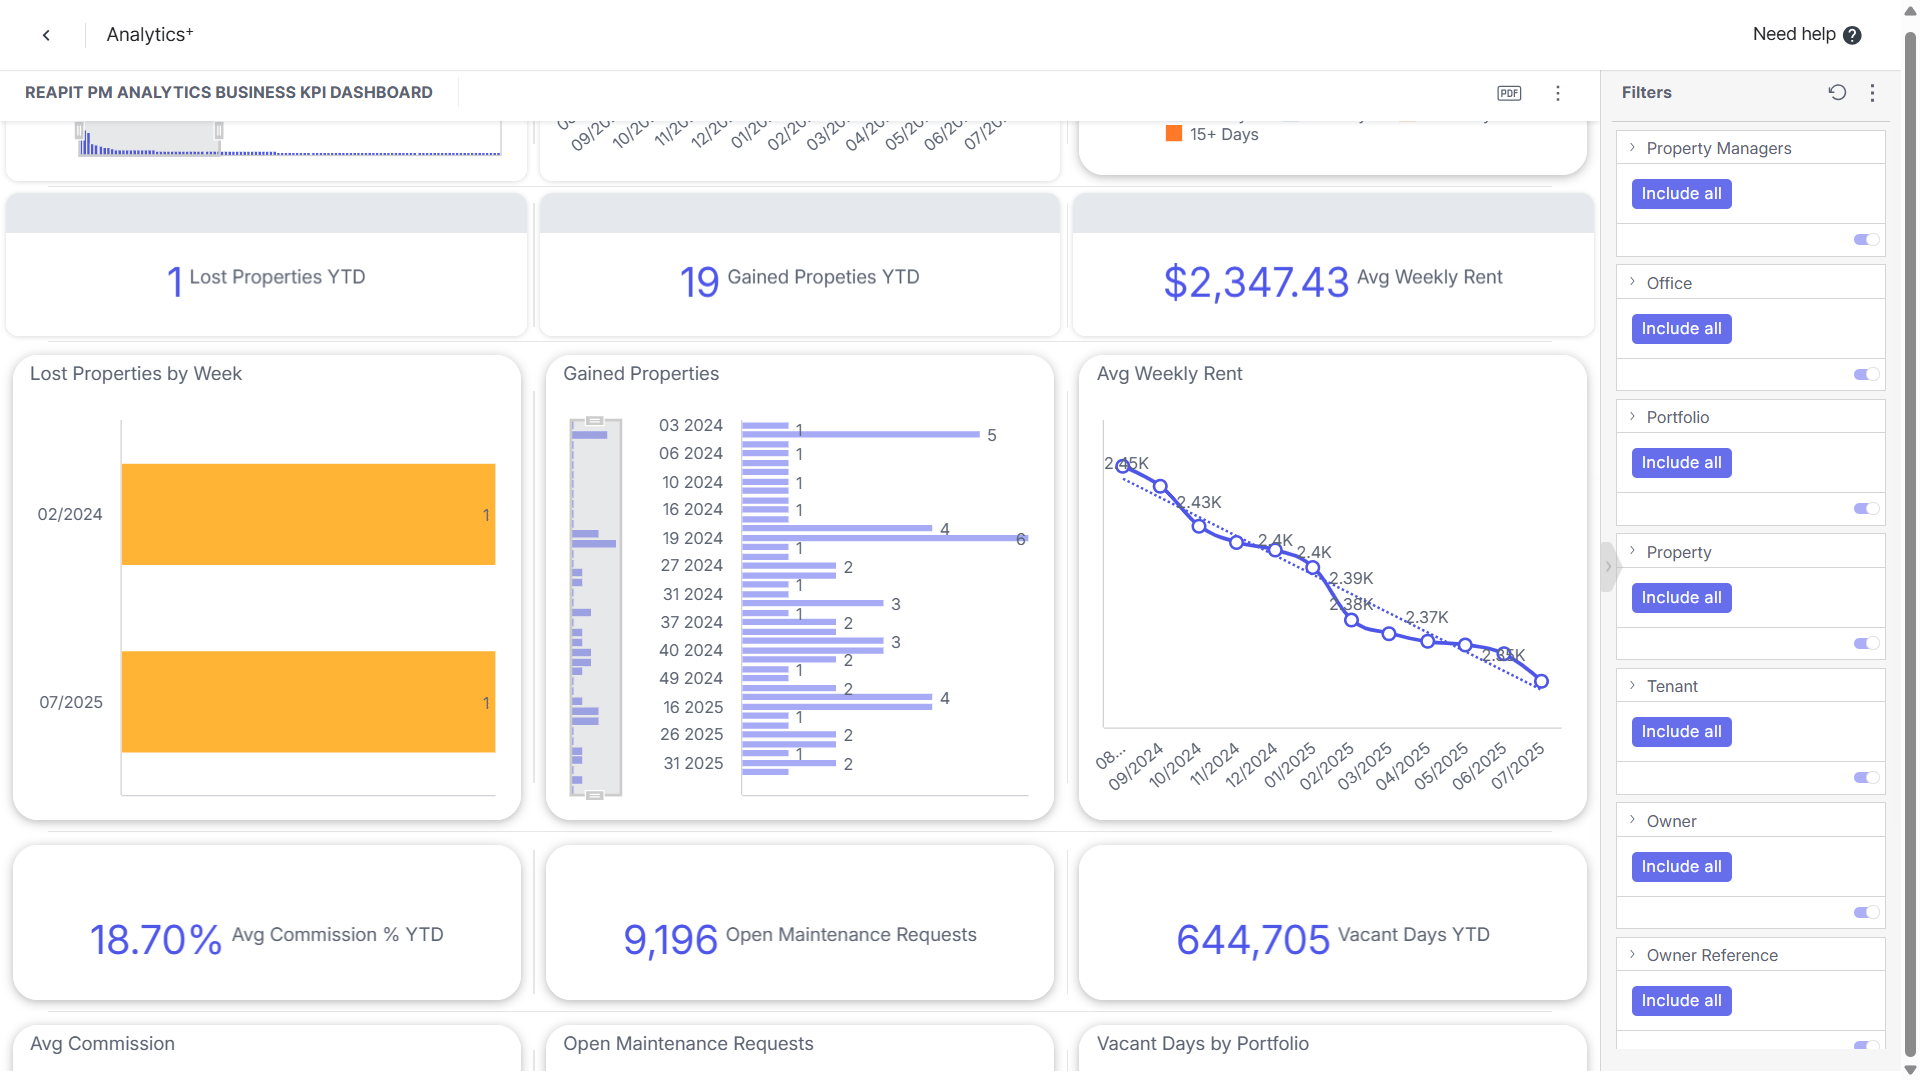
- Lost Property YTD
- Gained Properties
- Tenants in Arrears
- Average Commission YTD
- Open Maintenance Requests
- Vacant Days YTD
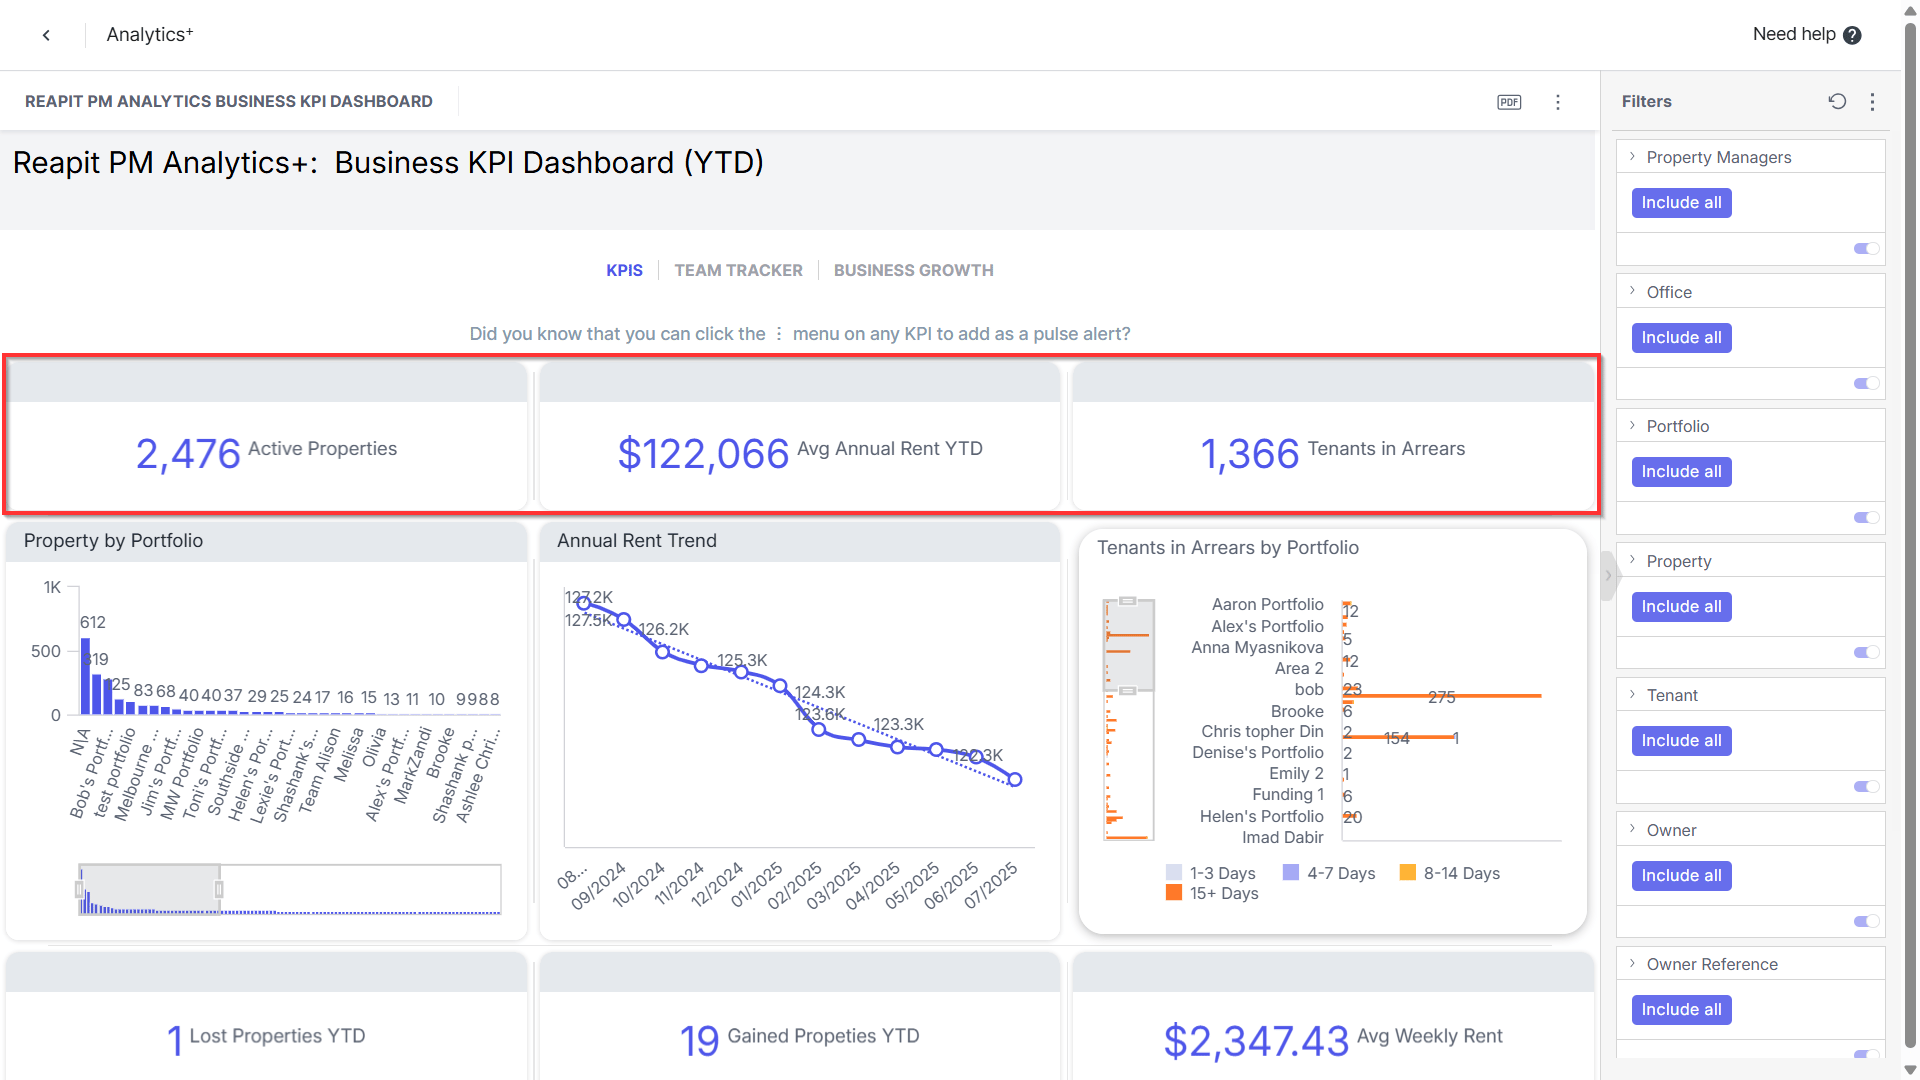
Business KPI Dashboard Charts:
- Properties by Portfolio
- Average Annual Rent
- Average Weekly Rent
- Lost Properties by Week
- Gained Properties
- Tenants in Arrears
- Average Commission
- Open Requests
- Vacant Days by Portfolio
Business KPI Report
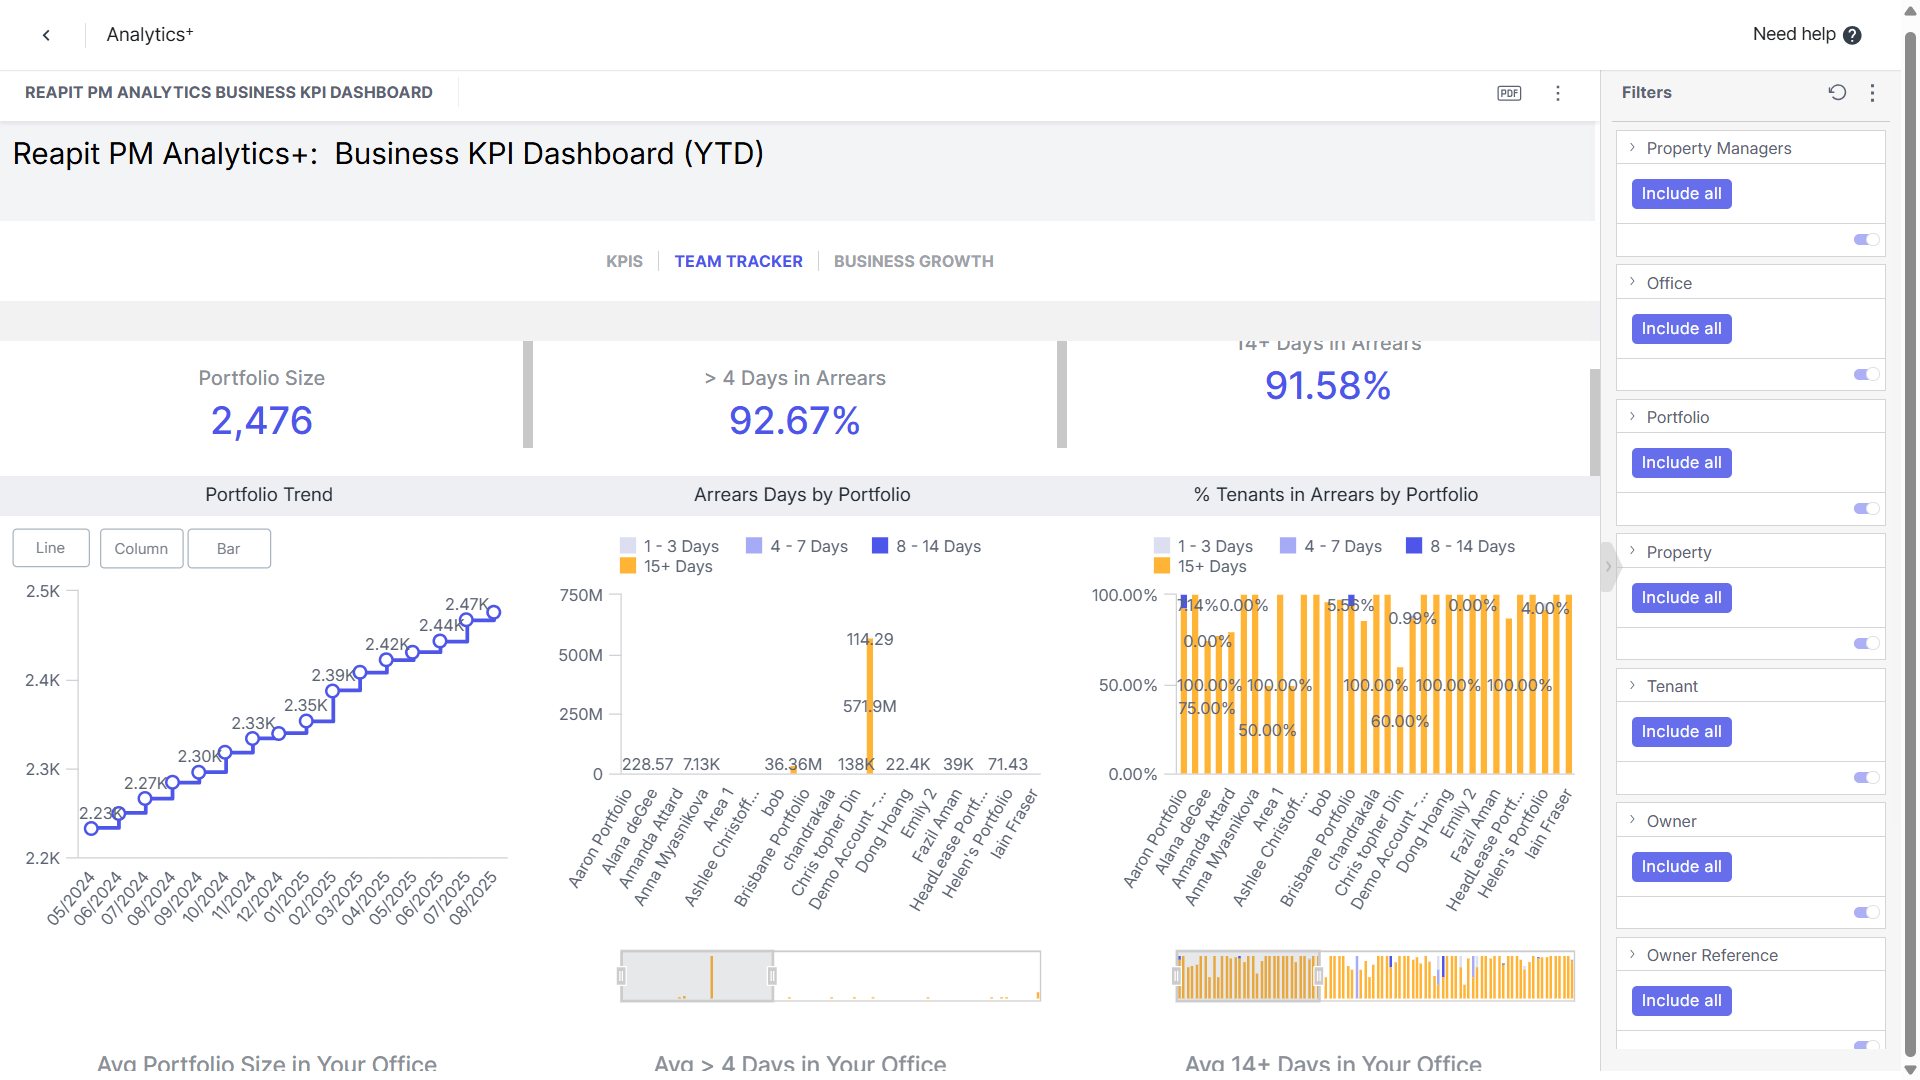
You can toggle to the Team Tracker Report which provides a one page report displaying key metrics for you and your team including arrears, portfolio size, vacant properties. In addition to the avg metric value across the Reapit PM client base. This graphical report is designed for individuals and teams to track performance.
Property Manager KPI Dashboard
Property Manager KPIs:
- YTD Cancelled Leases
- Leases Renewed
- Inspections Today
- Periodic Leases
- Maintenance Closure
- Average Arrears
- Annual Rent
- Tent Variance
- Current Vacant Days
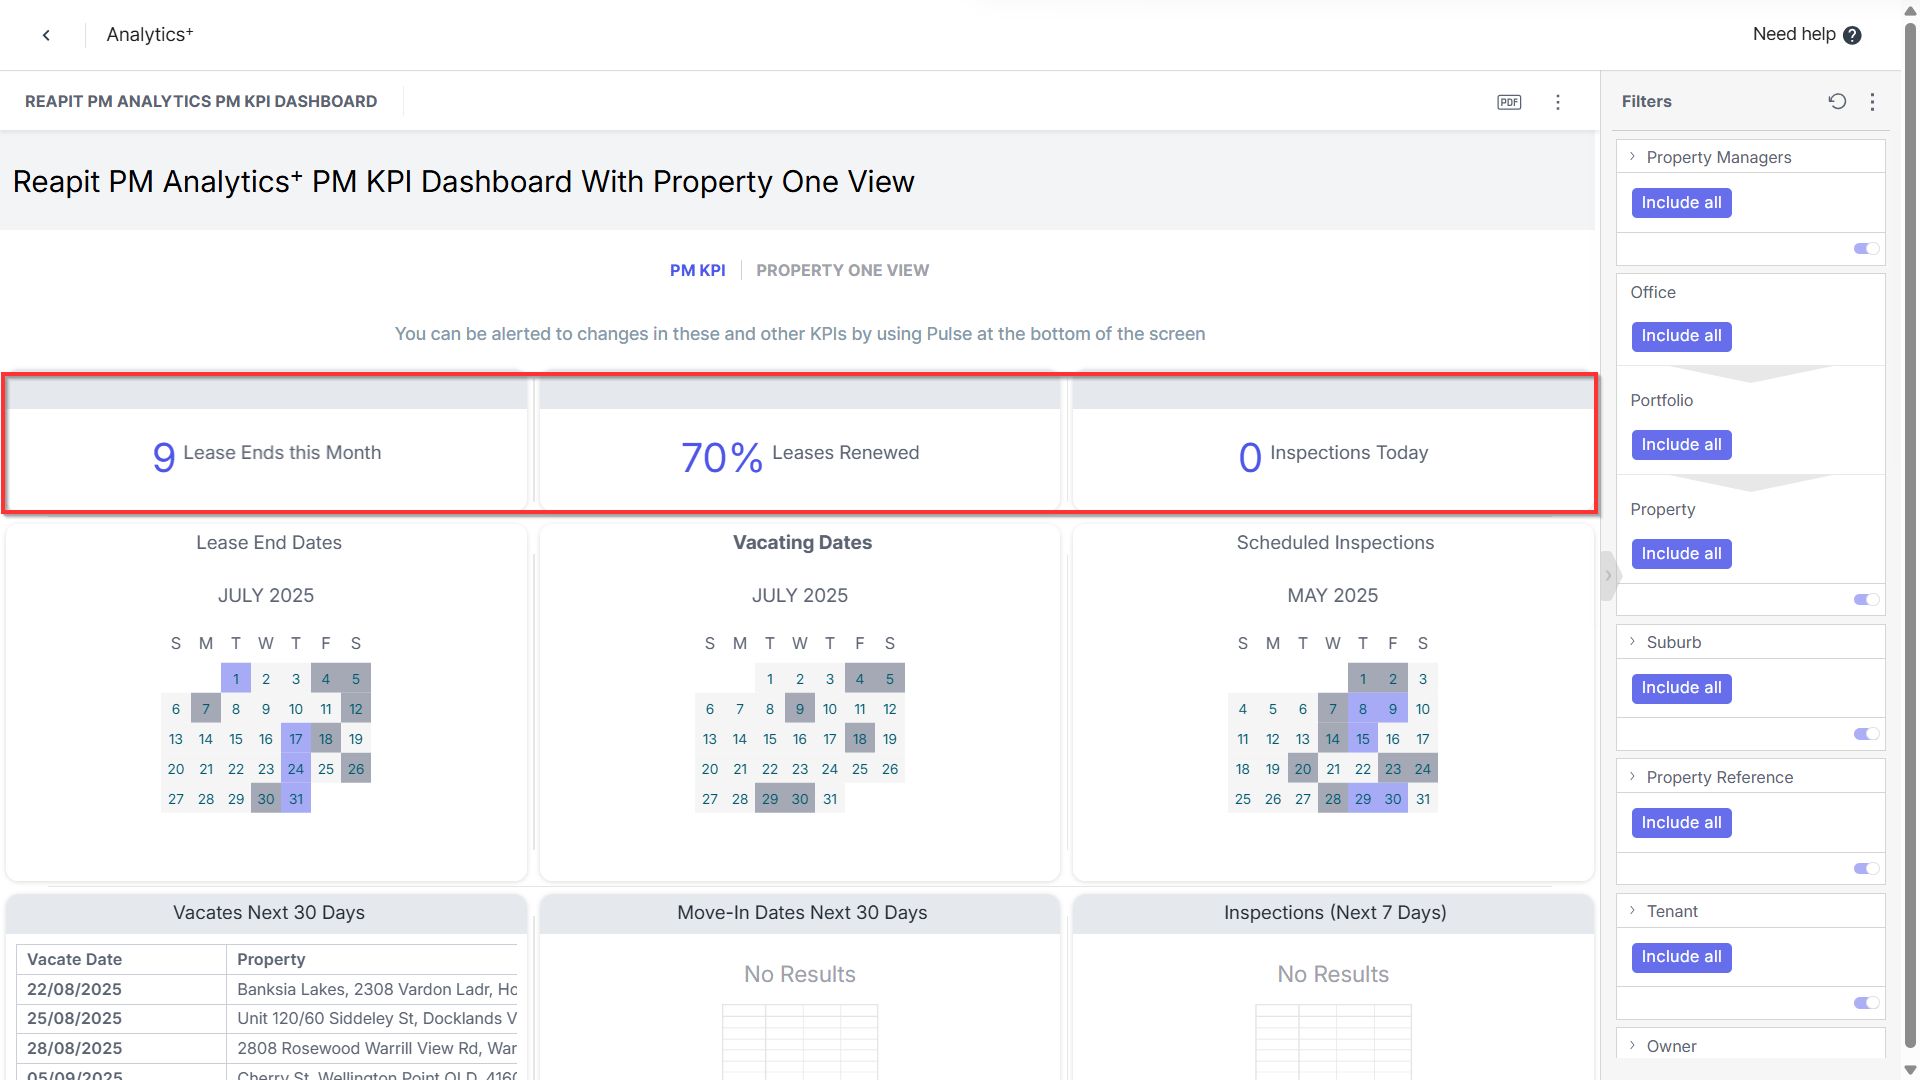
Property Manager KPI Dashboard Charts
- Lease End Dates
- Vacating Dates
- Scheduled Inspections
- Portfolio View - Property without Lease Ends
- Maintenance Closure
- Average Arrears by Portfolio
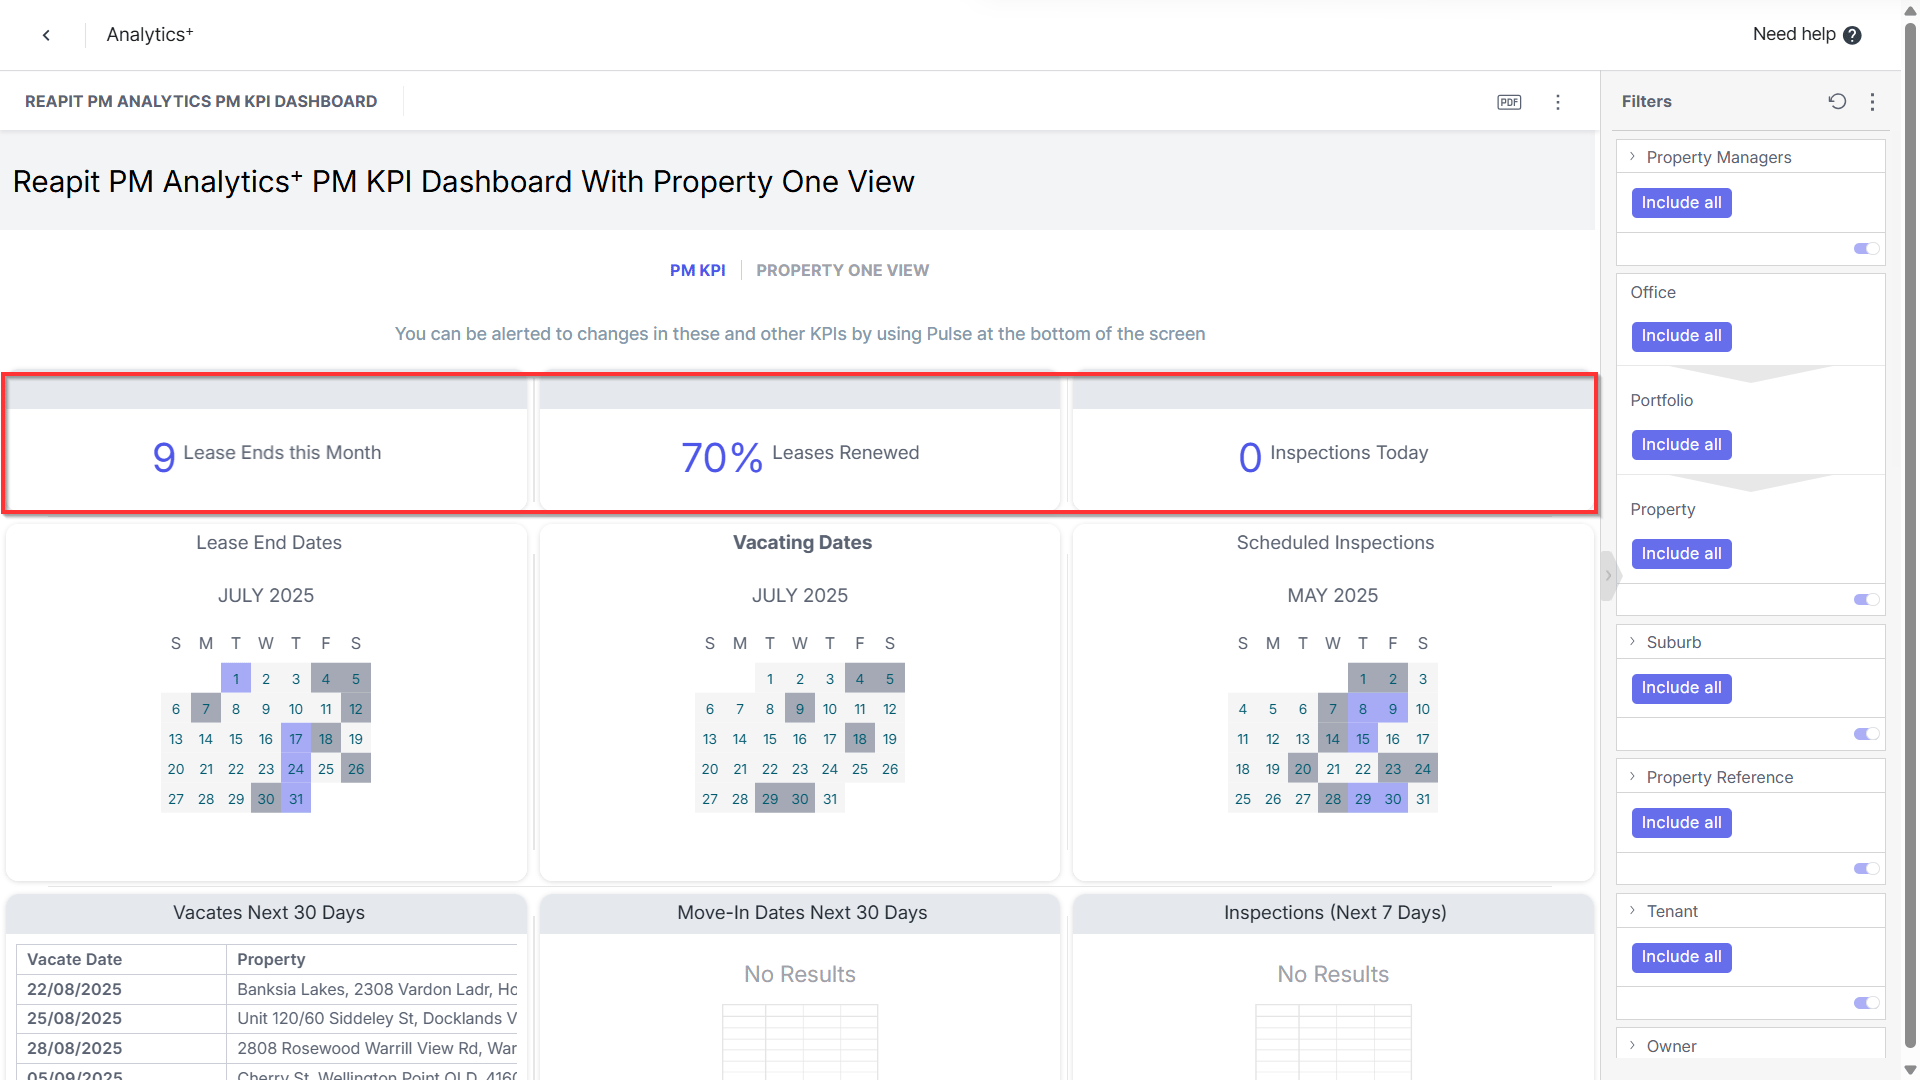
Property Manager KPI Report
You can toggle to the Property One View Report which provides a one page report detailing all key attributes, contacts and events relating the the Property. In addition to Owner contact data you will also see upcoming inspections, compliance and ongoing Maintenance. The report also details tenancy information such as arrears and days in property along with contact information.
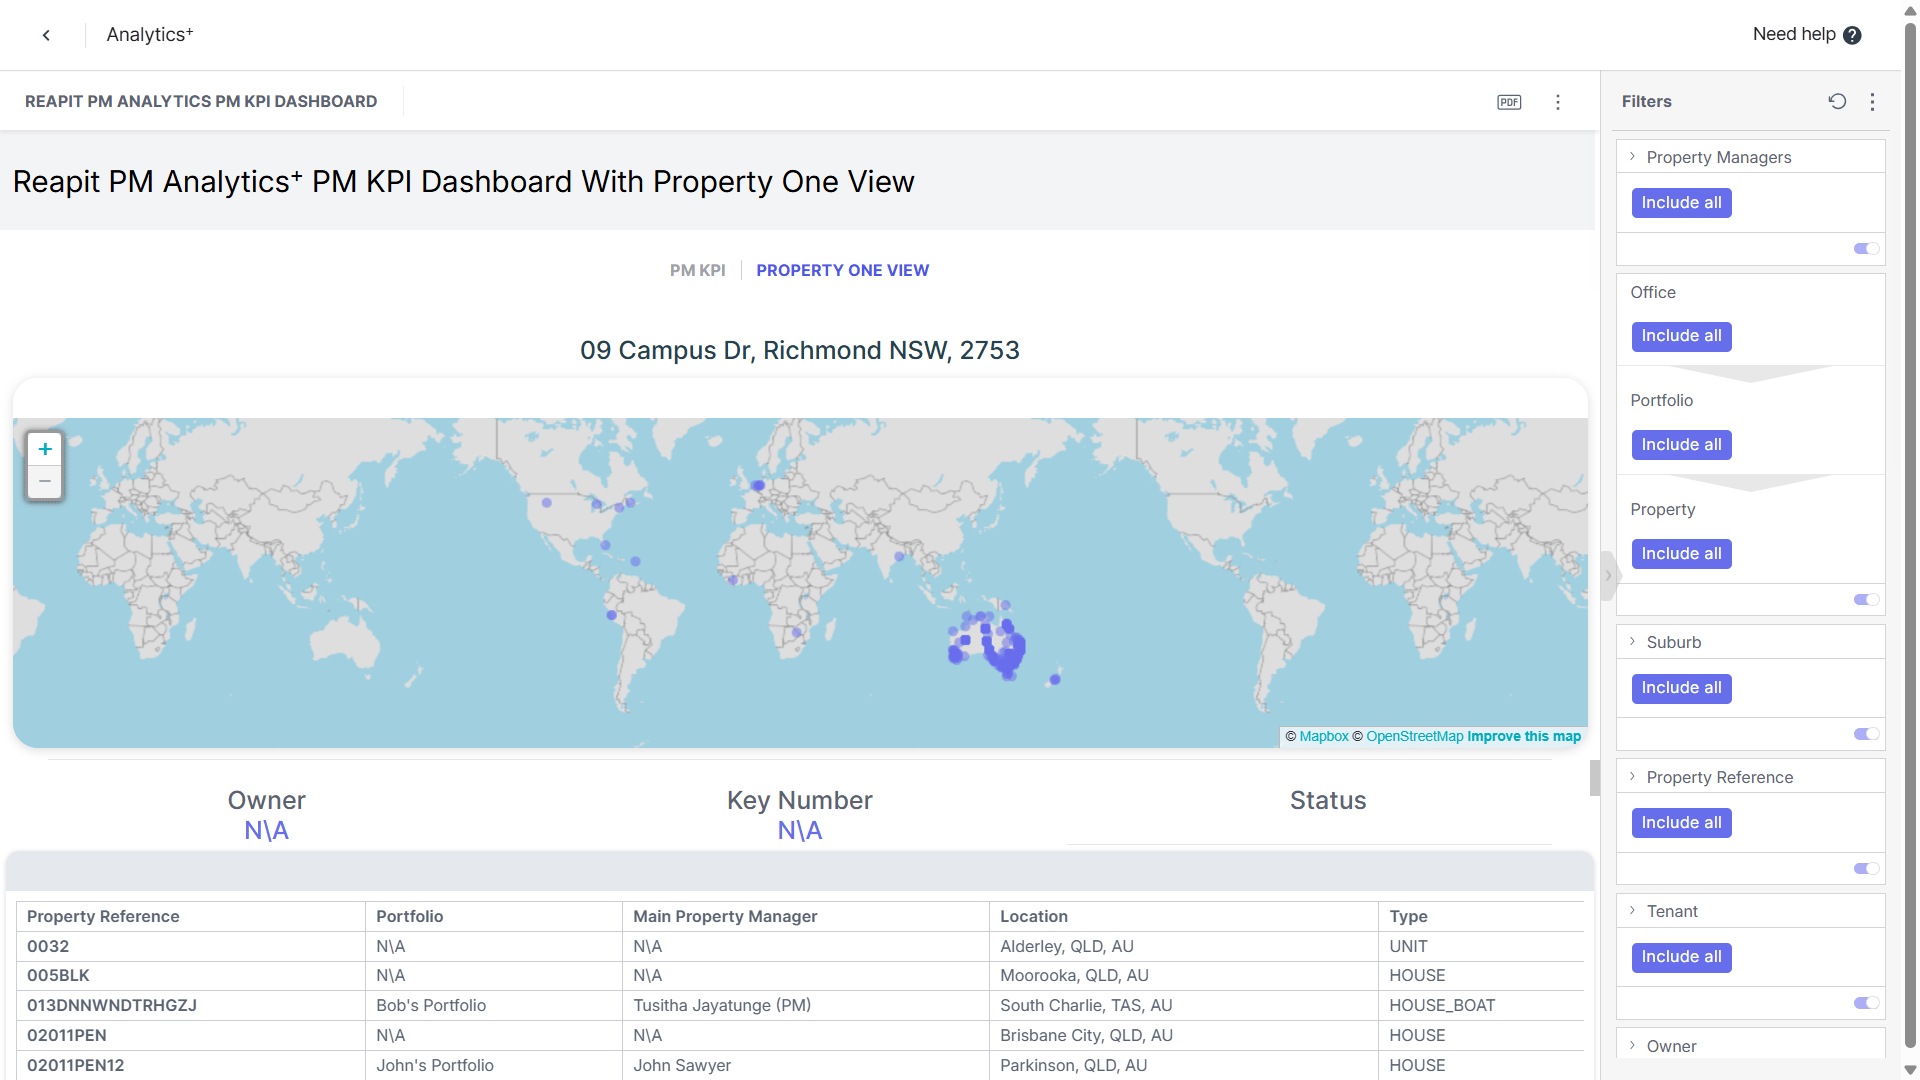
Property Performance Report
- Property Performance Report KPIs
- No of Properties that have an Average Economic Level
- No of Properties that have an Economic Level
- No of Properties that have an Uneconomic Level
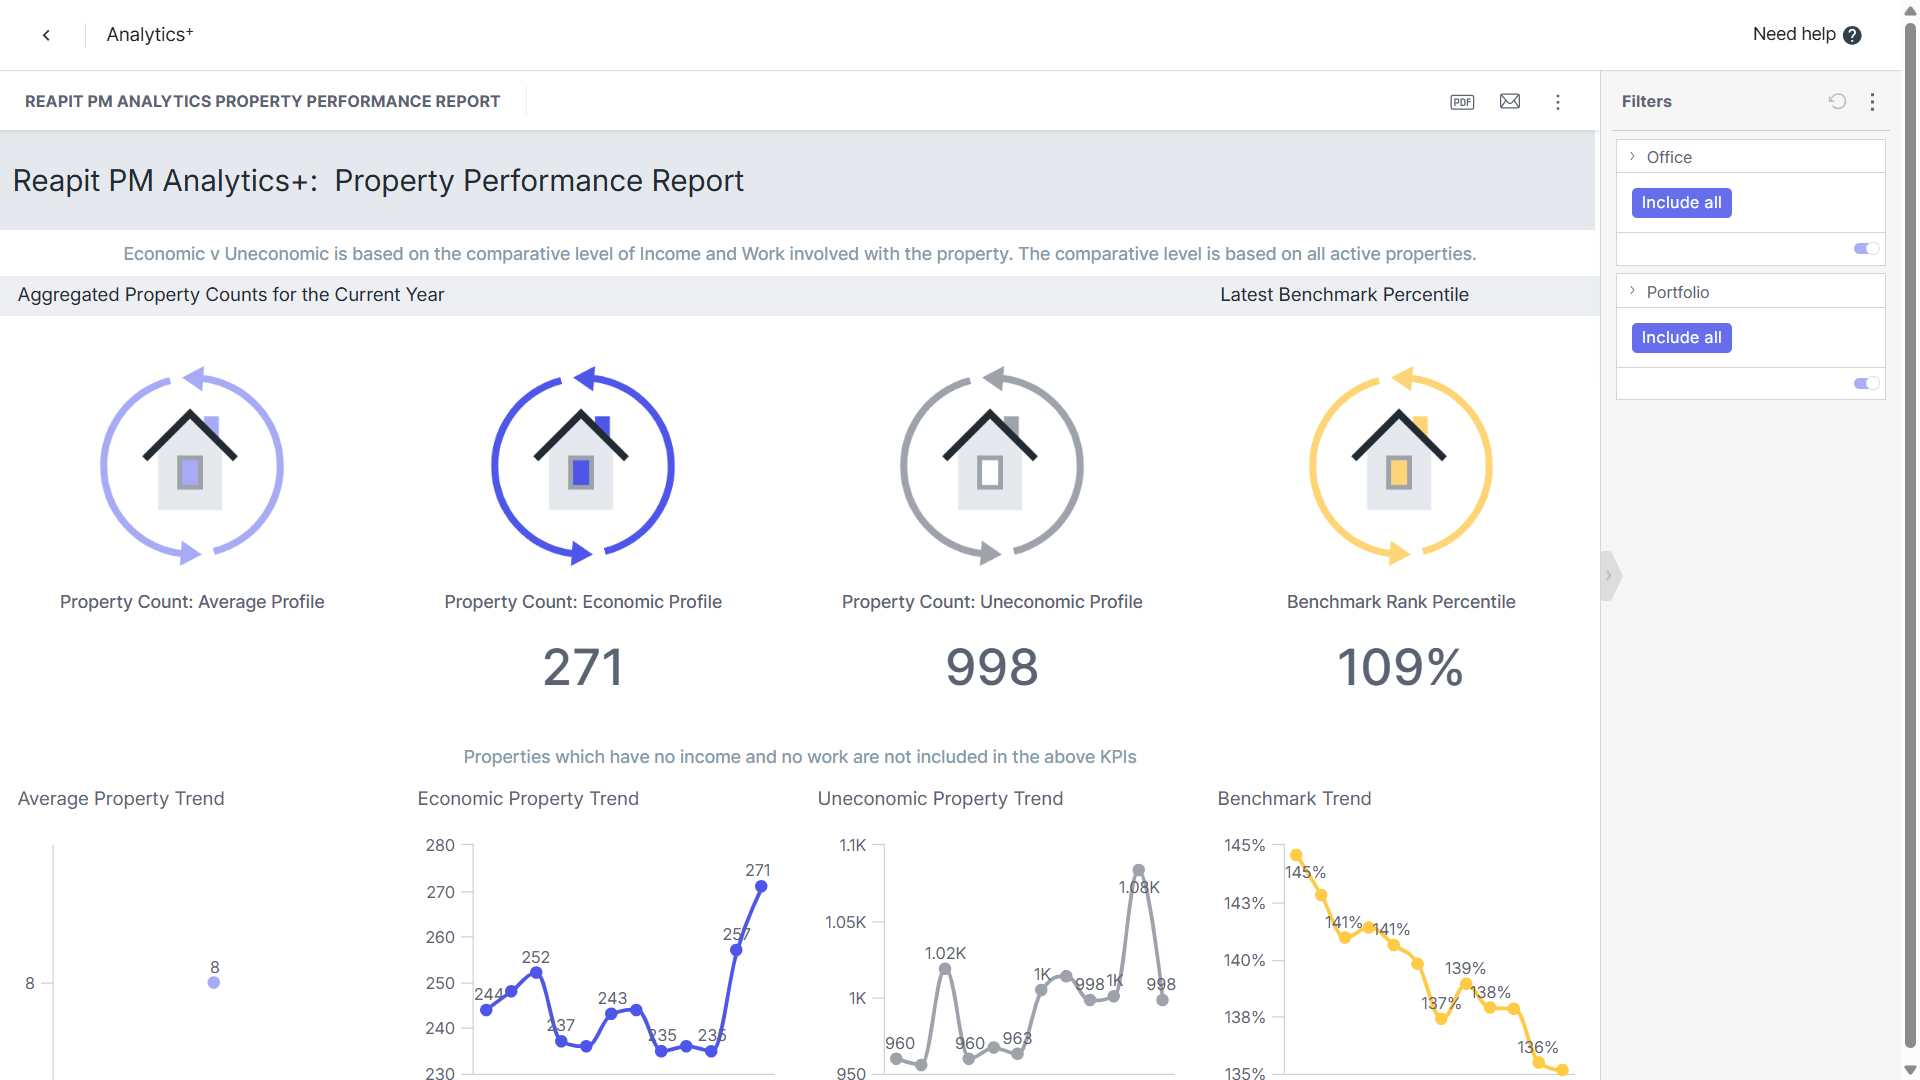
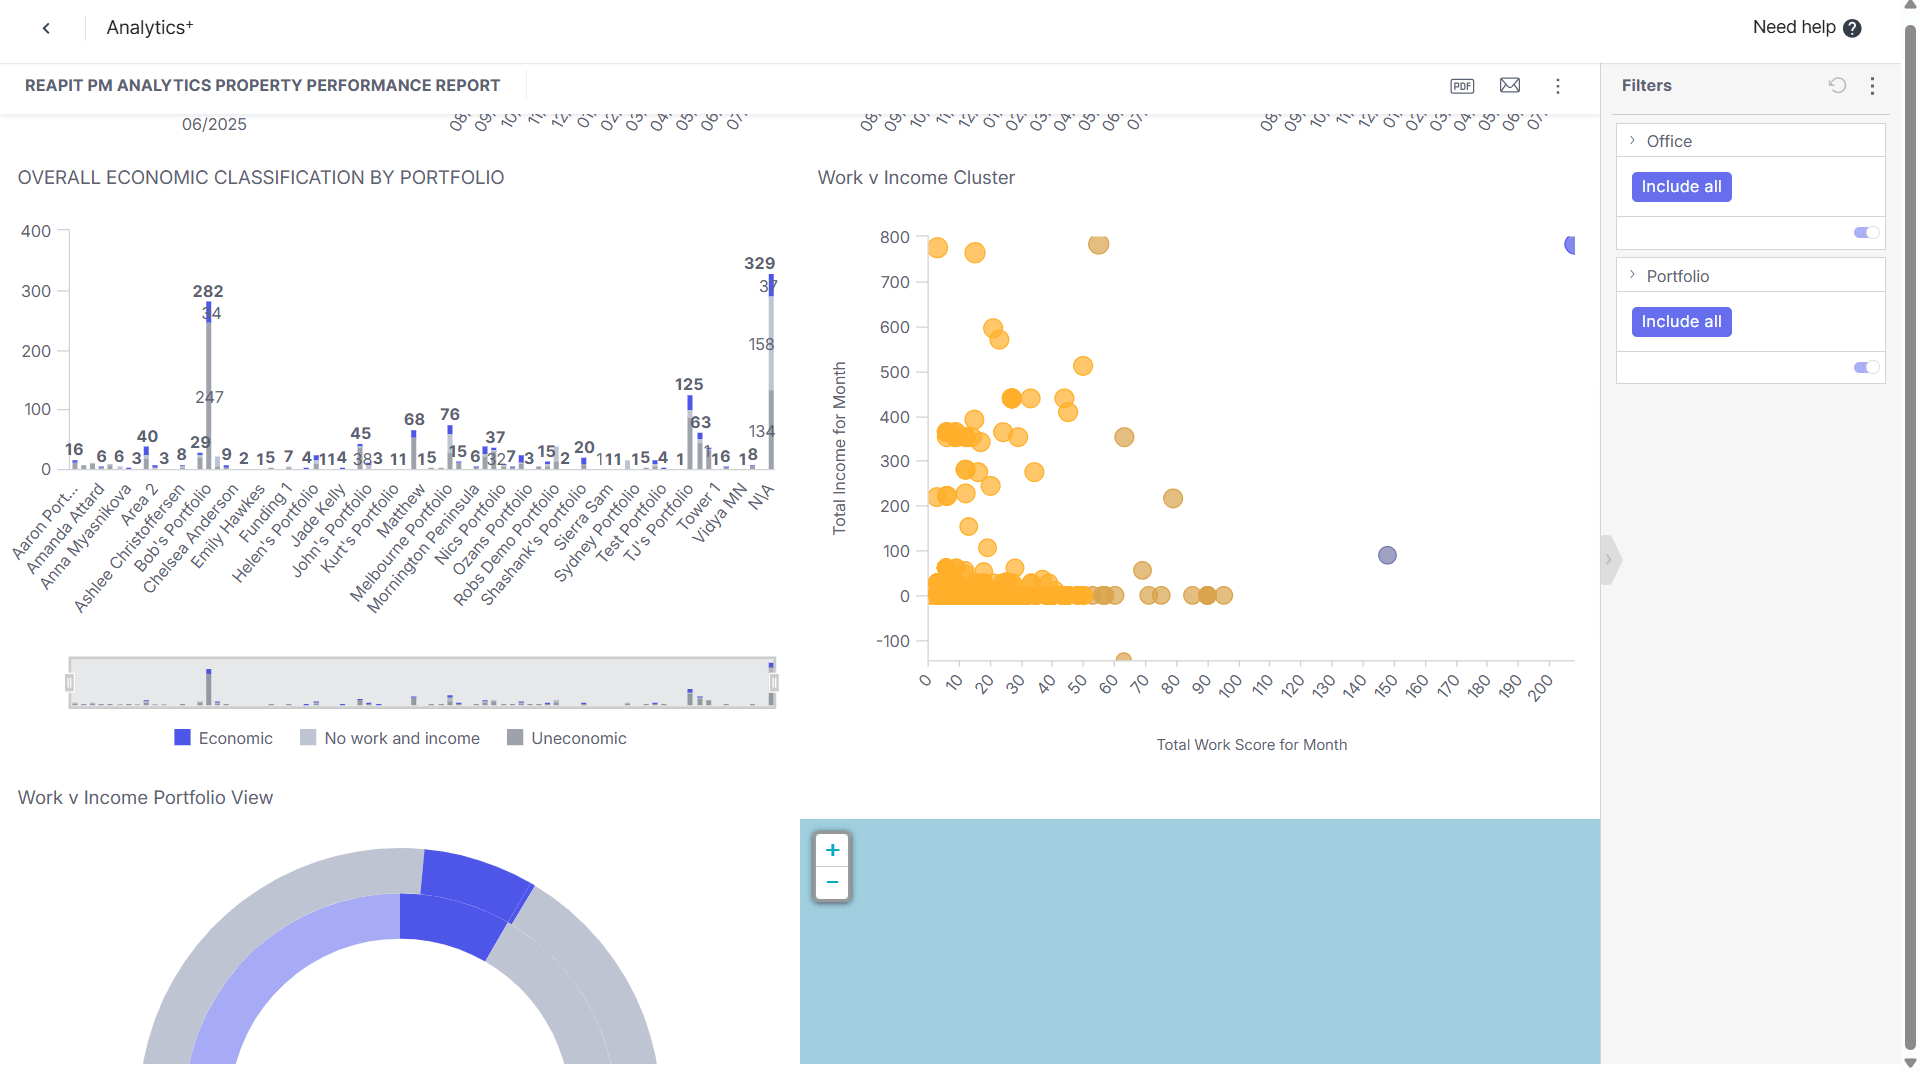
Property Performance Report Charts
- Average Property Trend
- Economic Property Trend
- Uneconomic Property Trend
- Property Breakdown by work Effort and Income (Scatter and Map Charts)
- Economic Property Tab
- Uneconomic Property Table
Note: This is a report which has a fixed reporting period and all charts are showing income, effort and economic classification based on the previous month.
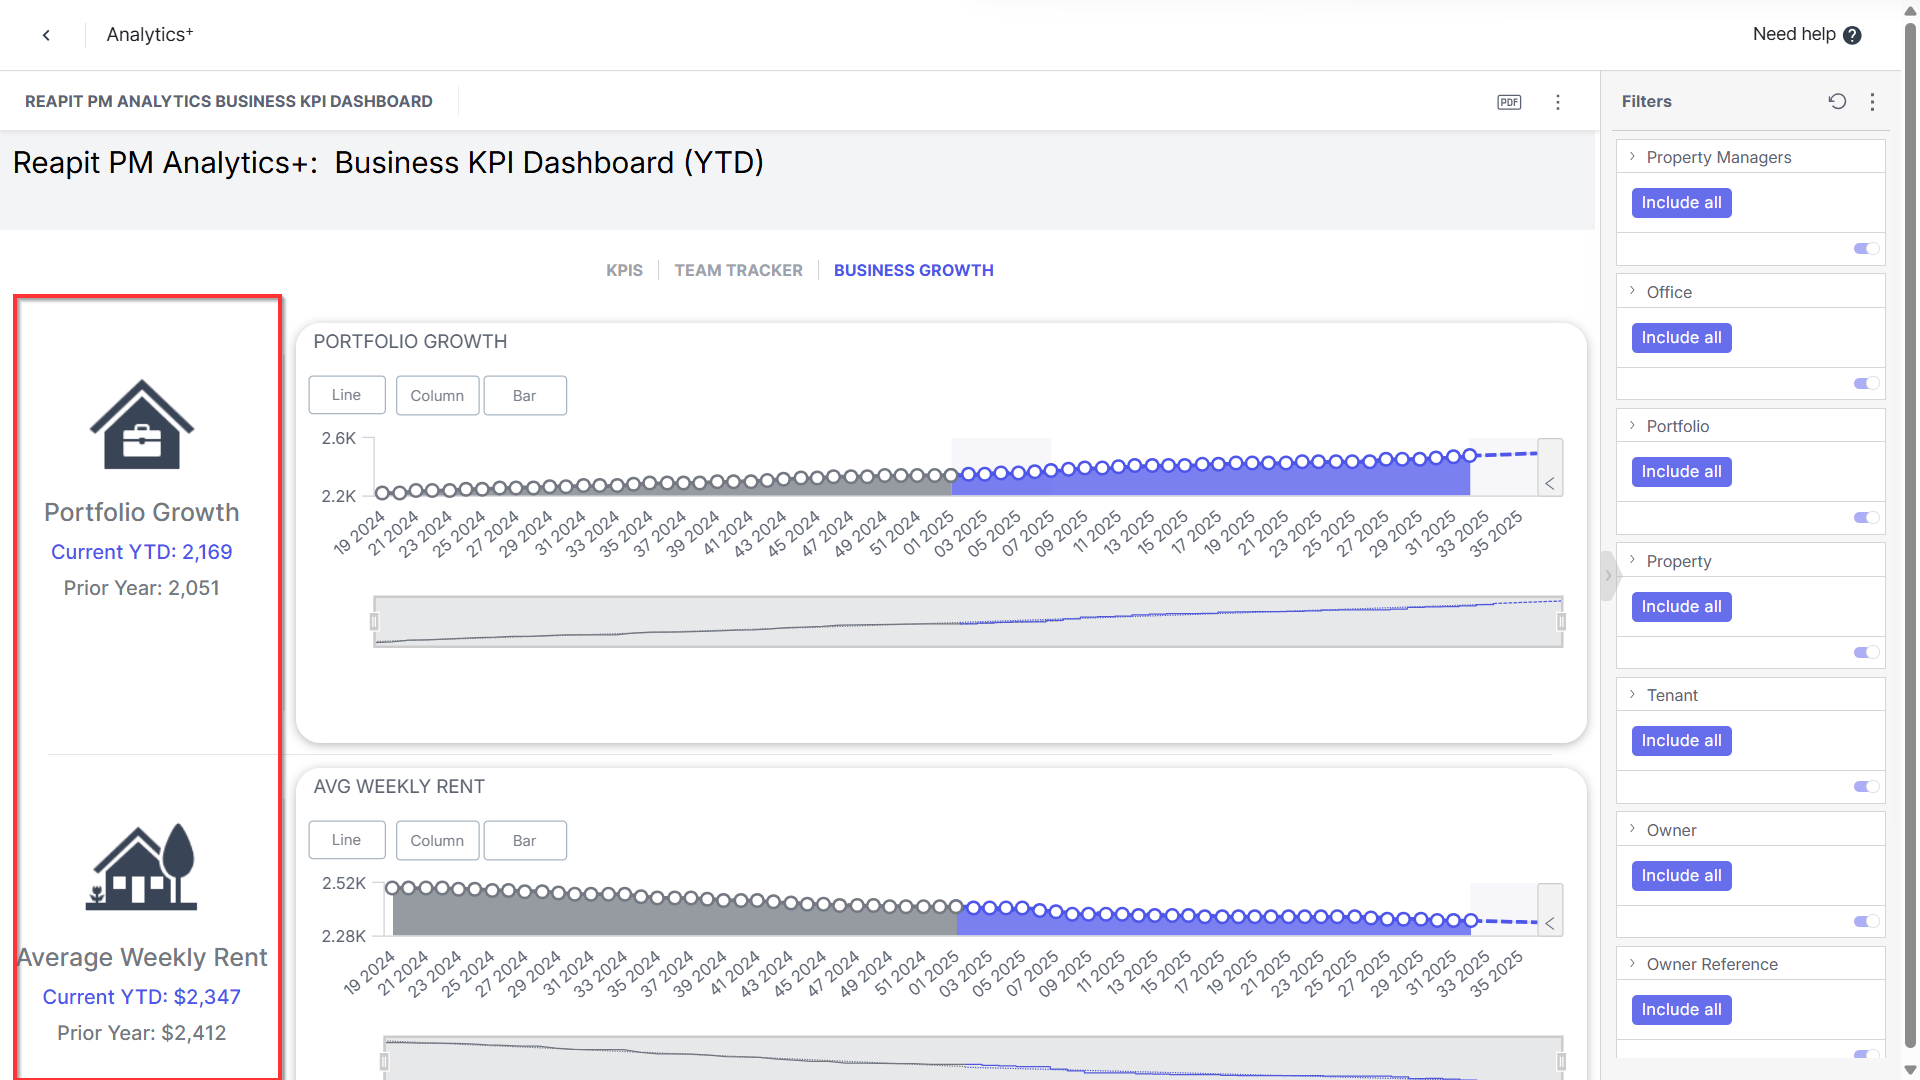
Business Growth Report
- Portfolio Growth
- Avg Weekly Rent
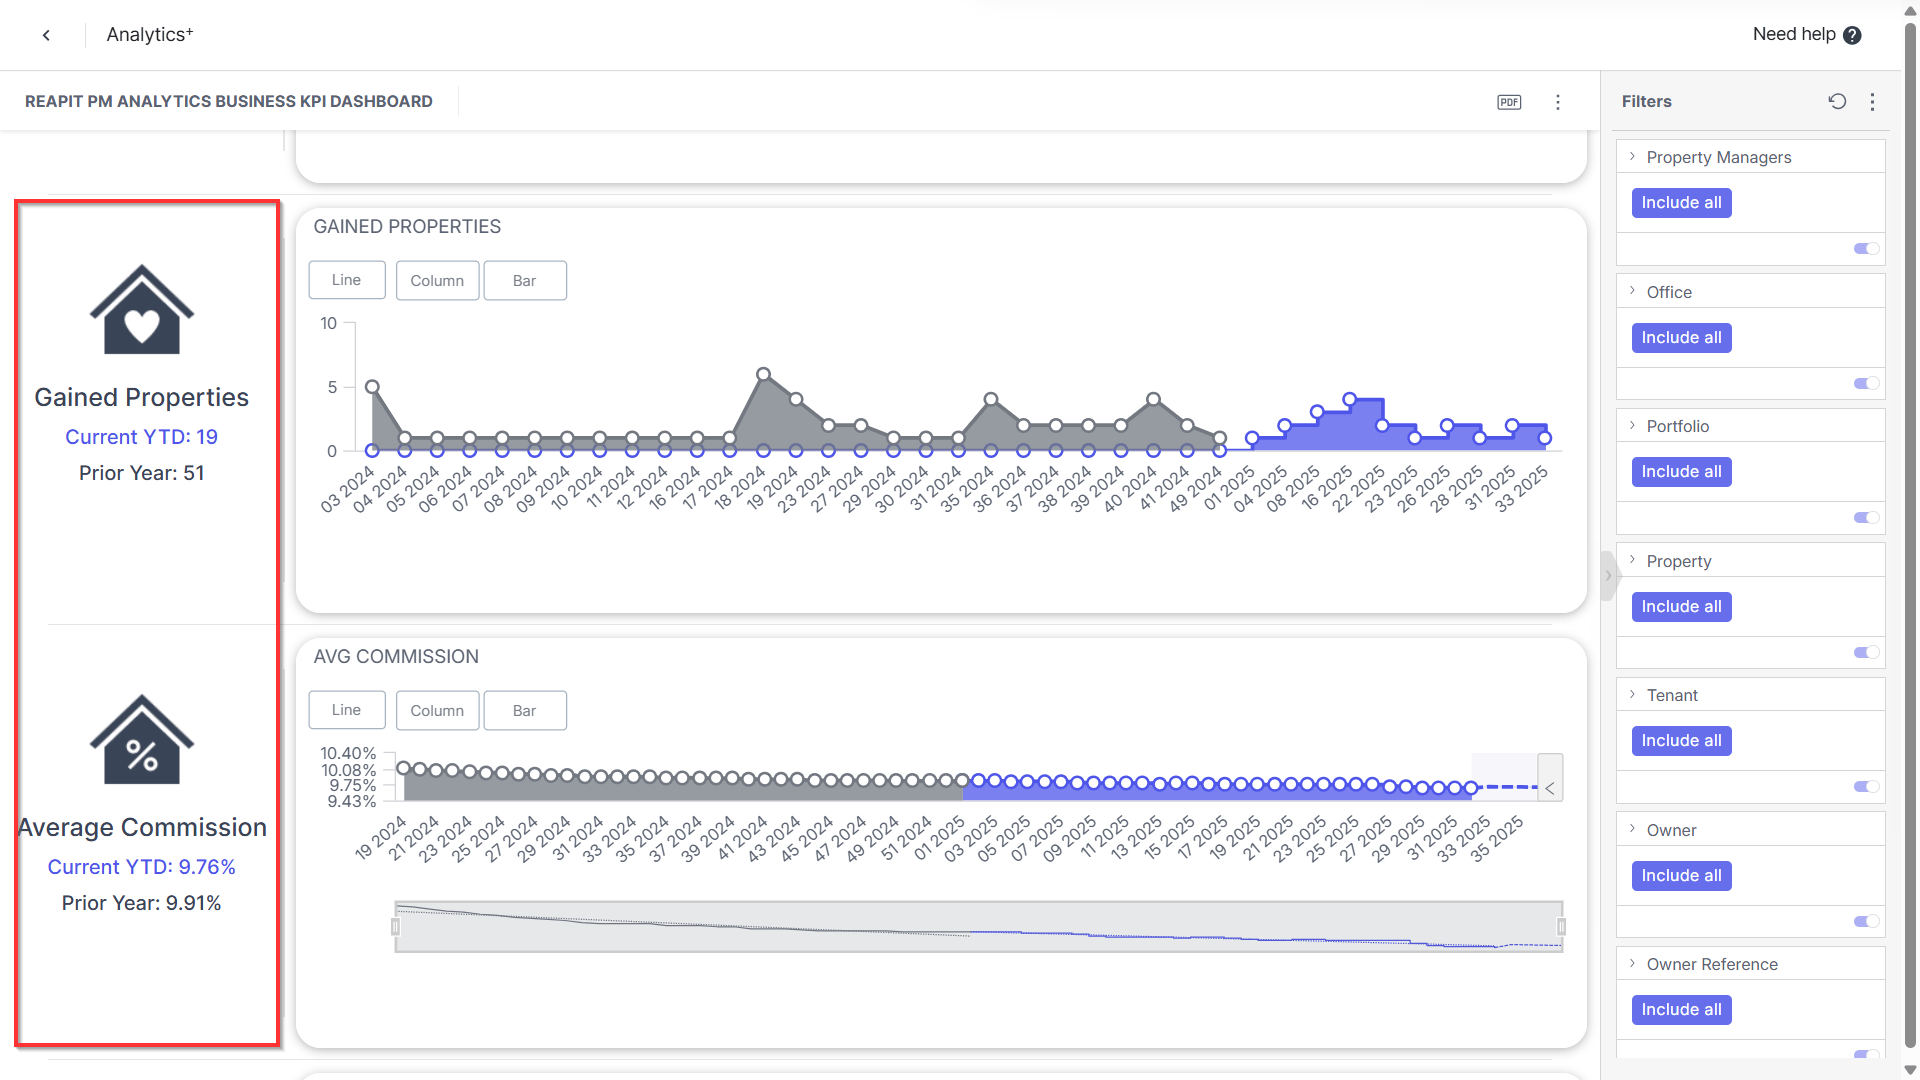
- Gained Properties
- Avg Commission
- Avg Fee Revenue
The report comprises five essential Key Performance Indicators (KPIs) and offers a comprehensive dataset spanning a rolling two-year period. This feature proves invaluable to consultants and senior managers, affording them the opportunity to assess the extent of growth that has transpired. Additionally, it incorporates a forecast functionality that can be toggled on or off by the user, along with a trendline for further analytical depth.
Data Cleanse Report
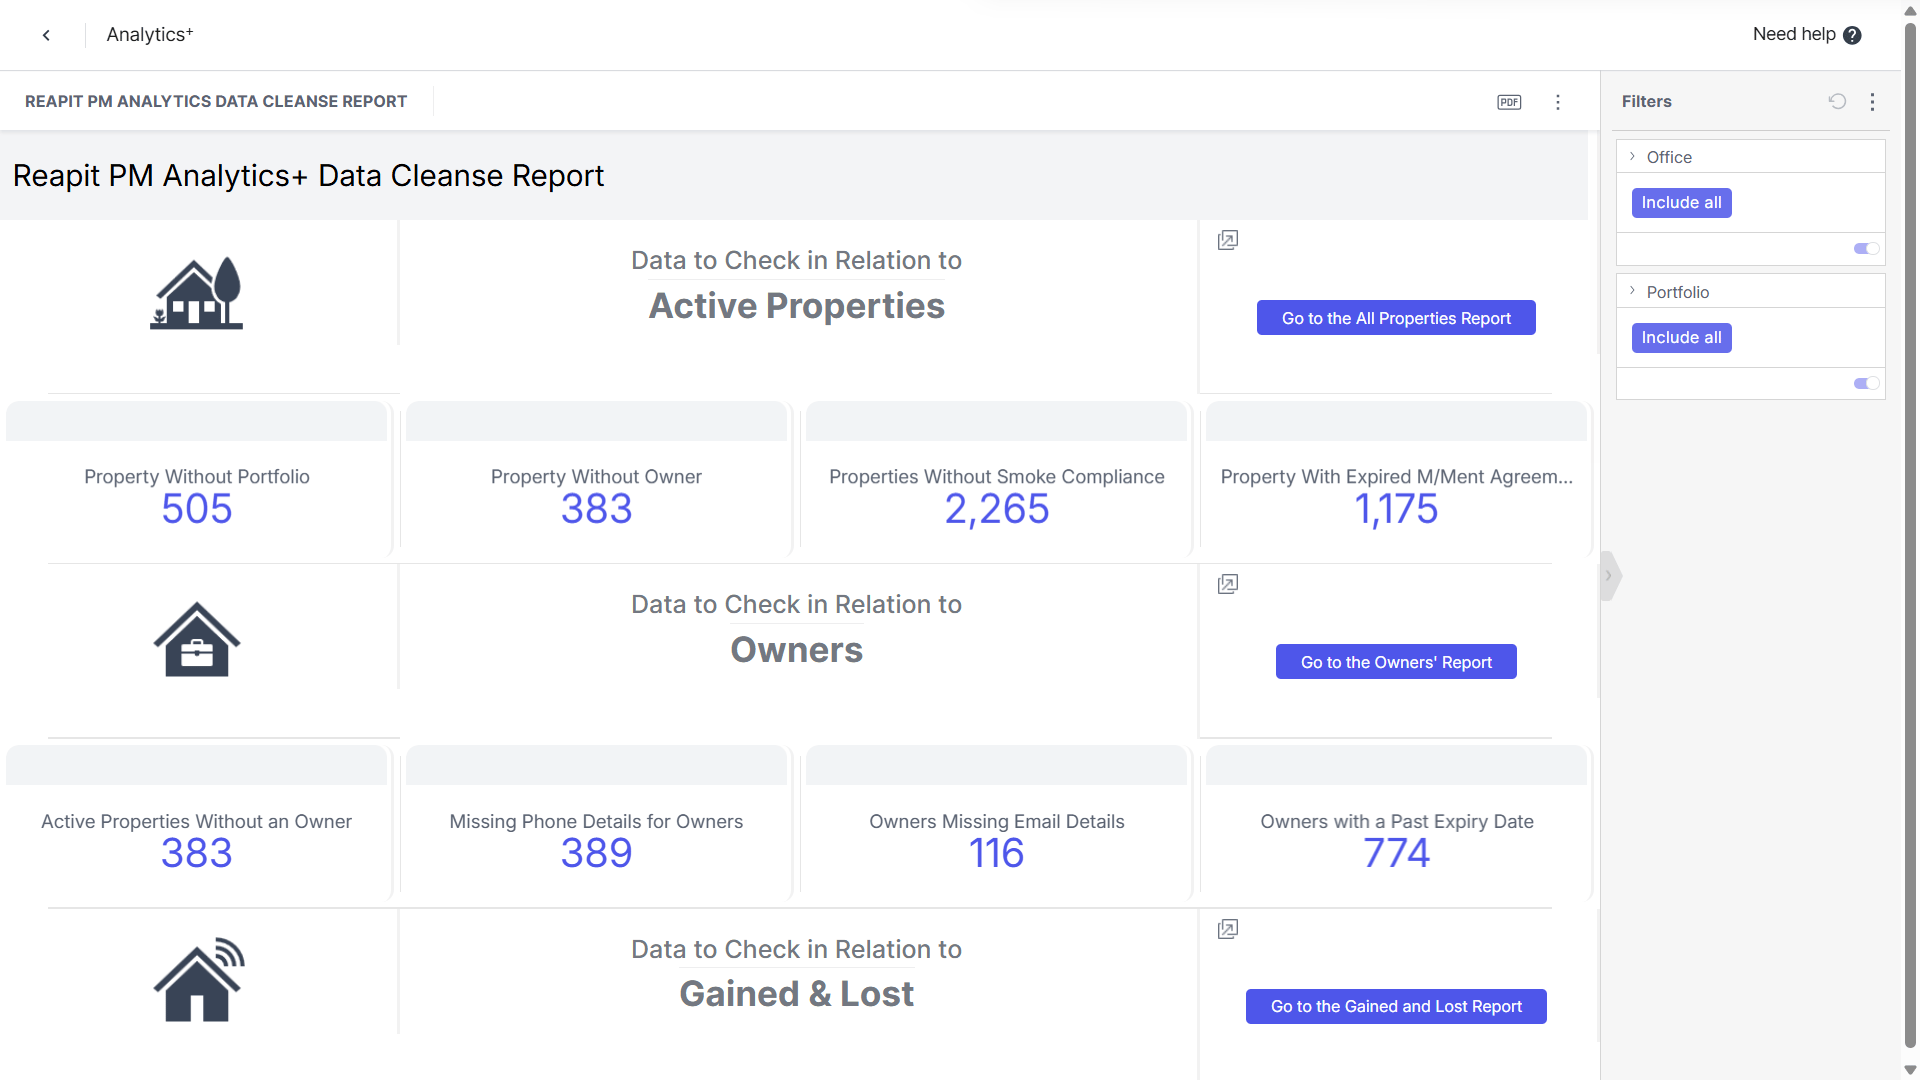
Data to check in relation to:
- Active Properties
- Owners
- Gained & lost Detail
- Tenants
- Rent & Revenue
- Inspections
- Keys & Maintenance
This report focuses on data and examines 28 KPIs that warrant close attention. These KPIs serve as critical indicators of potential issues, primarily stemming from data entry methods or manual errors during data handling.
The report offers a breakdown of these KPIs, categorising them into distinct segments, such as active properties, owners, tenant information, and more. This categorisation allows for a more detailed analysis of the data at hand.
Note: Use the scroll bar to access and analyse the other forementioned KPIs.
My Monthly Report
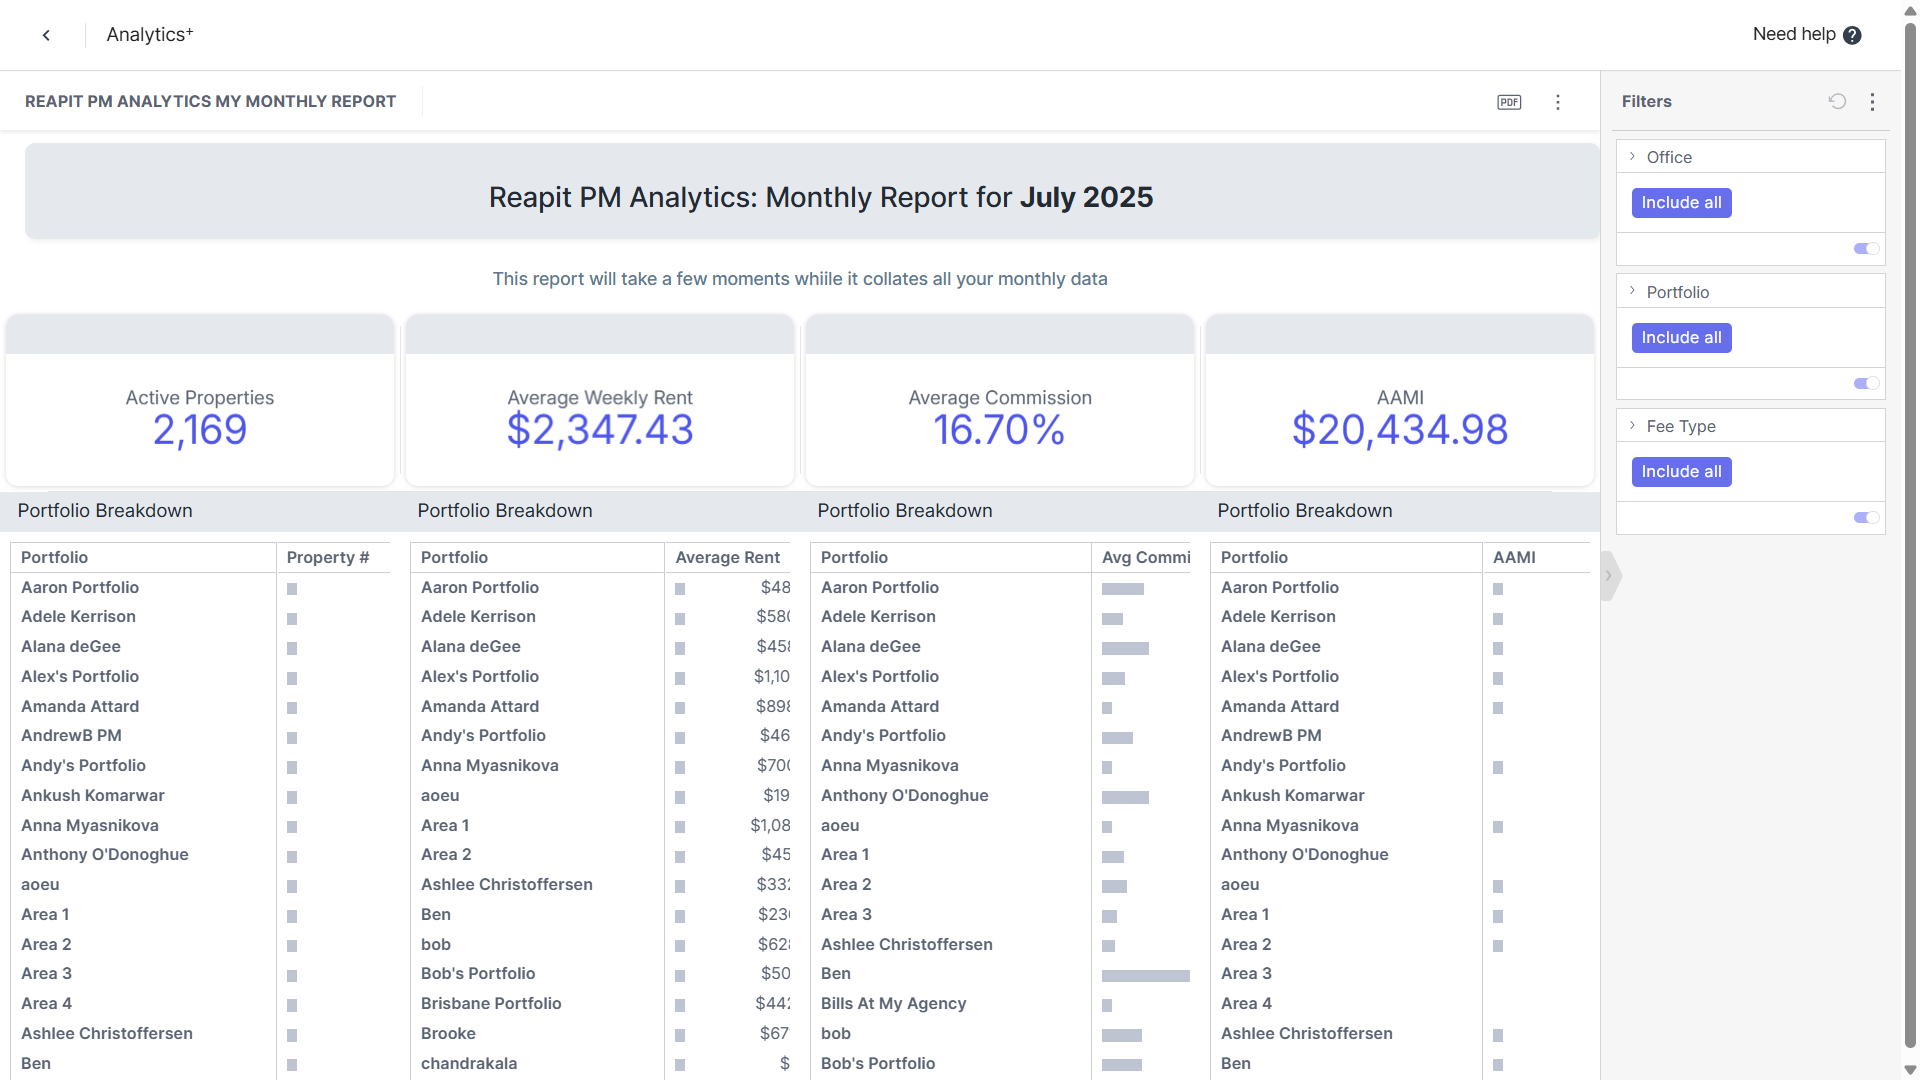
This reports provides a comprehensive array of metrics has been developed for your monthly reporting.
Each metric presents data from the previous month, accompanied by a detailed portfolio breakdown.
Referrals Report
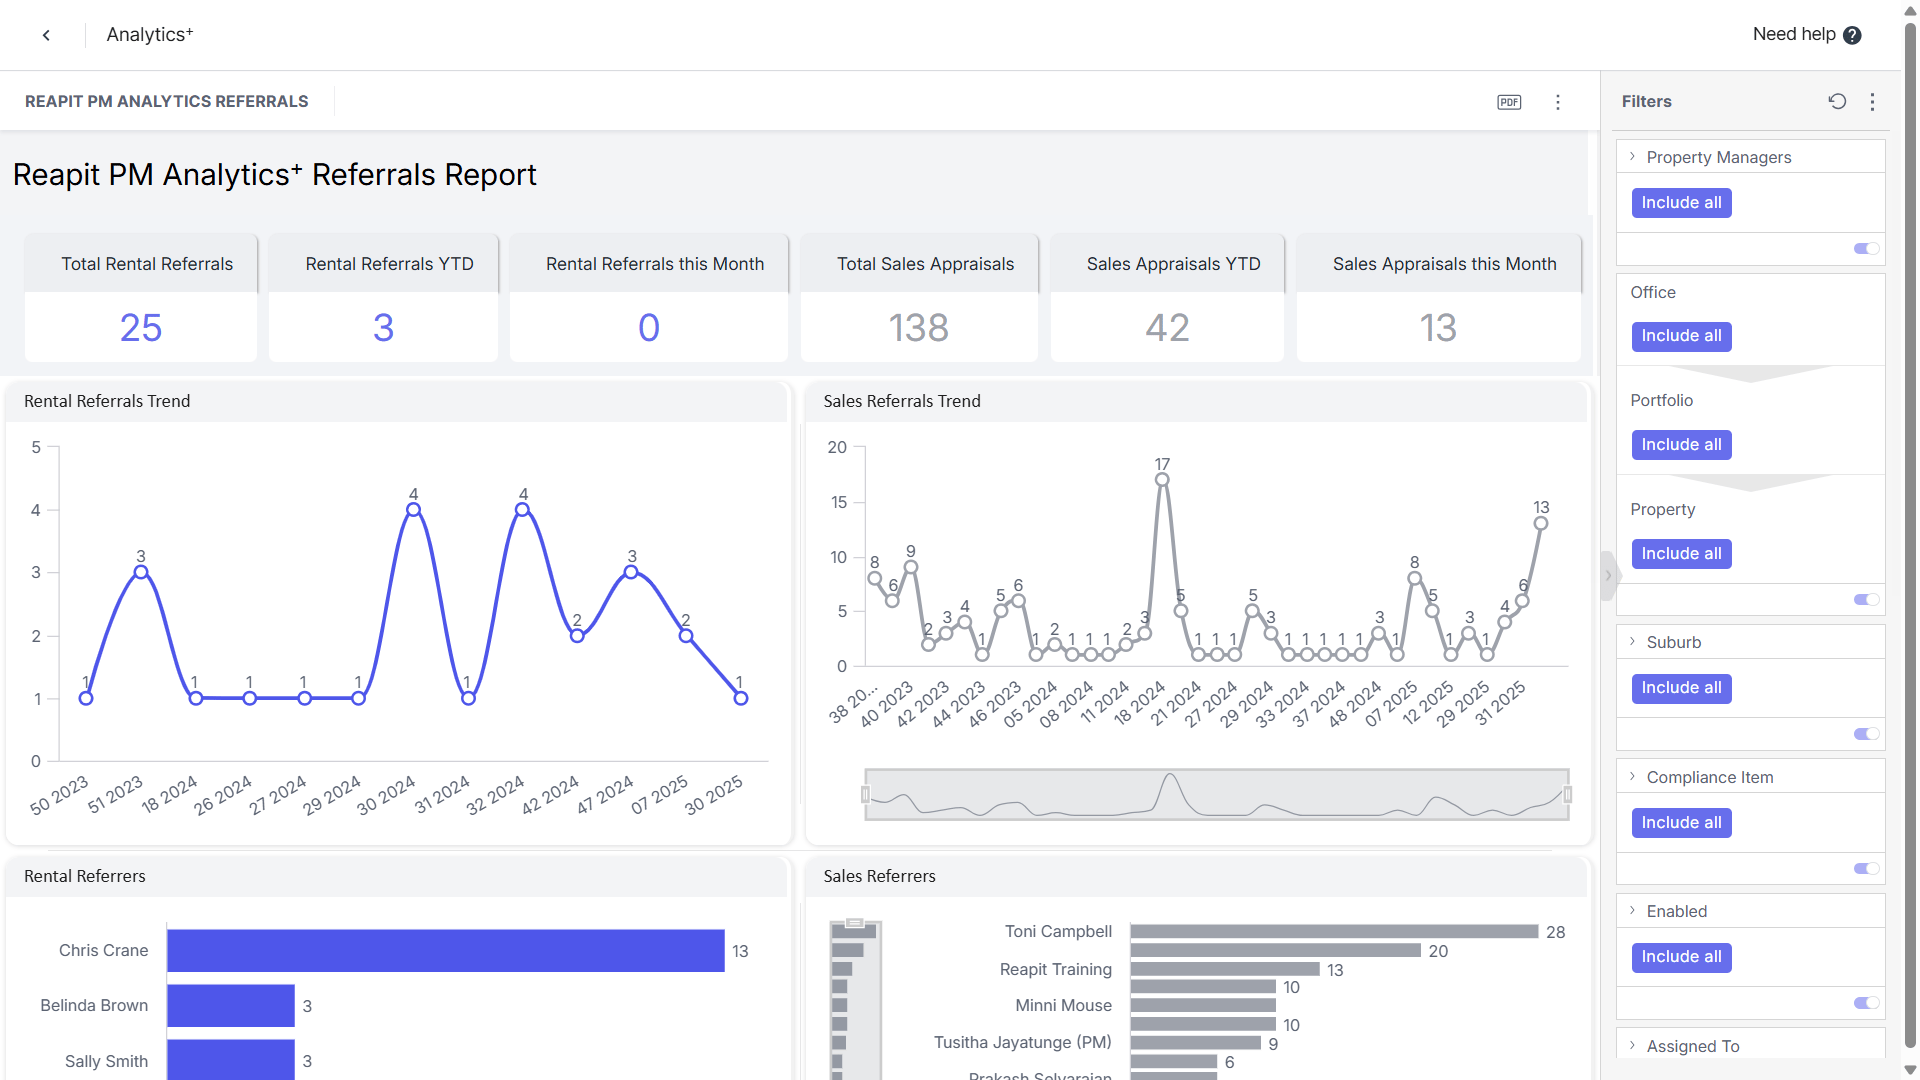
This report provides a detailed analysis of sales and rental referrals exchanged between Reapit PM and Agentbox, emphasising the integration of these platforms to guarantee that no sales or rental opportunities are overlooked.
This report encompasses the following charts:
- Rental Referrals Trend
- Sales Referrals Trend
- Rental Referrers
- Sales Referrers
- Rental Referral Details
- Sales Referral Details
Commercial Tenancy Schedule Report
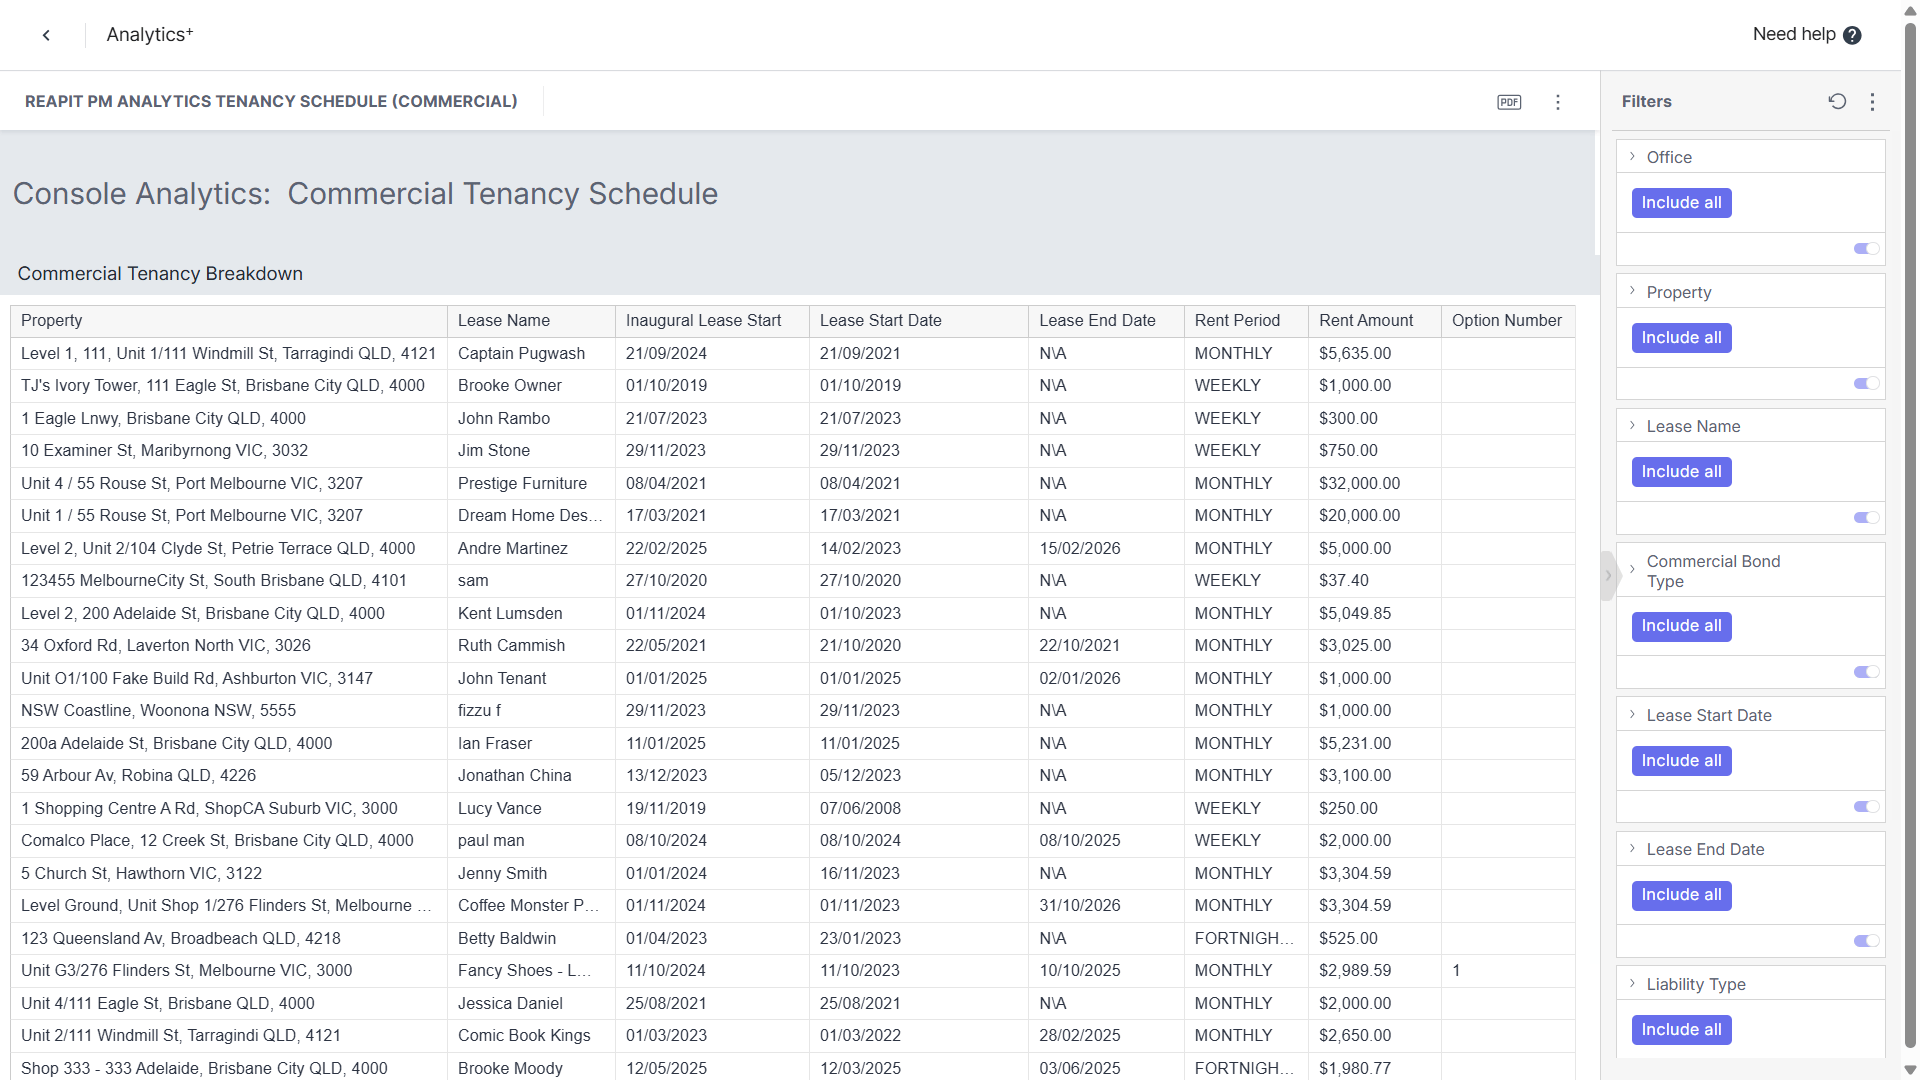
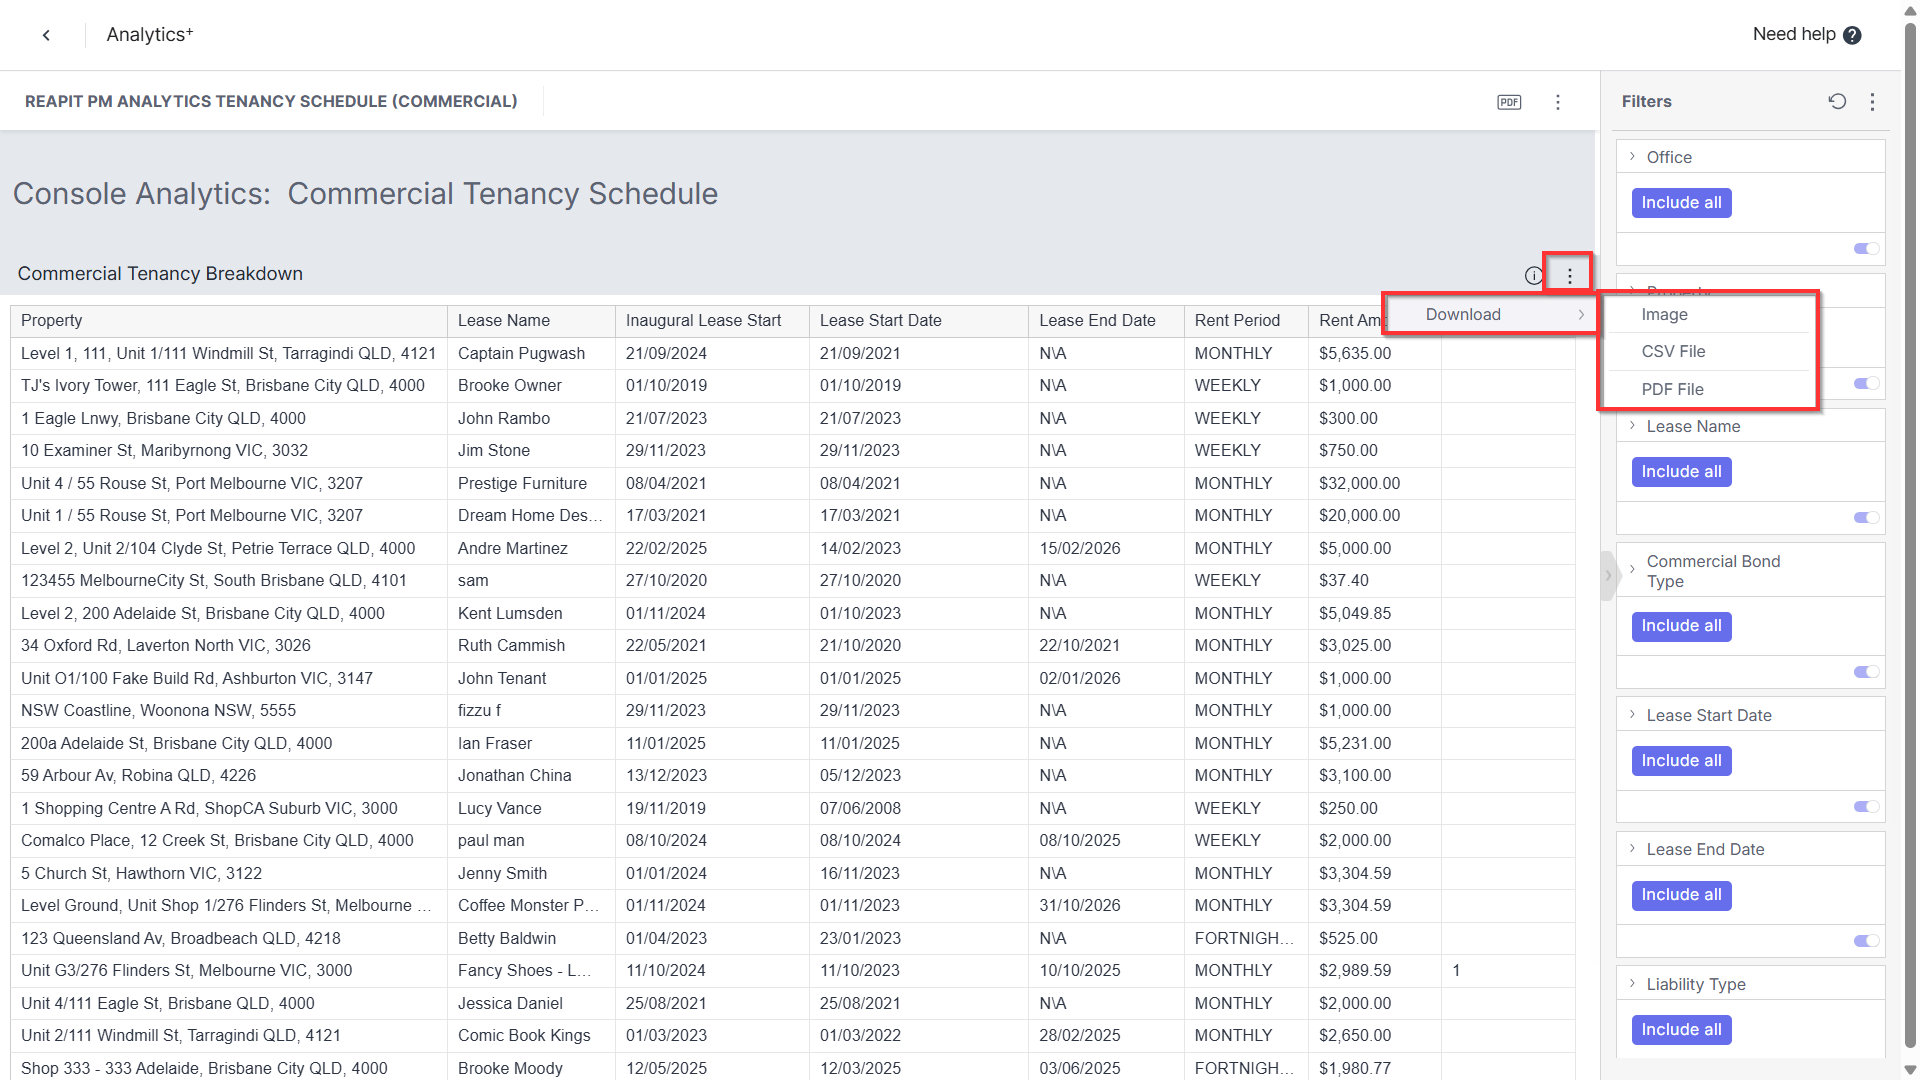
This report is a comprehensive CSV-type report designed to consolidate critical commercial tenancy information, and includes essential details such as lease dates, rent amounts, and breakdowns of options like renewals and lease extensions. The report is designed to provide a clear and organised view of all commercial tenancies in one place.
Key Features of the Report
Derived Values in Columns*:*
- Calculated Annual Rent: This value is derived by taking the current monthly rent (applicable only for monthly periods) and multiplying it by 12 to get an annual figure.
- Floor Area: Represented in square meters (SQM), this column provides the size of the leased area.
- Calculated Annual $/SQM: This value is calculated by dividing the annual rent by the floor area, providing a cost per square meter annually.
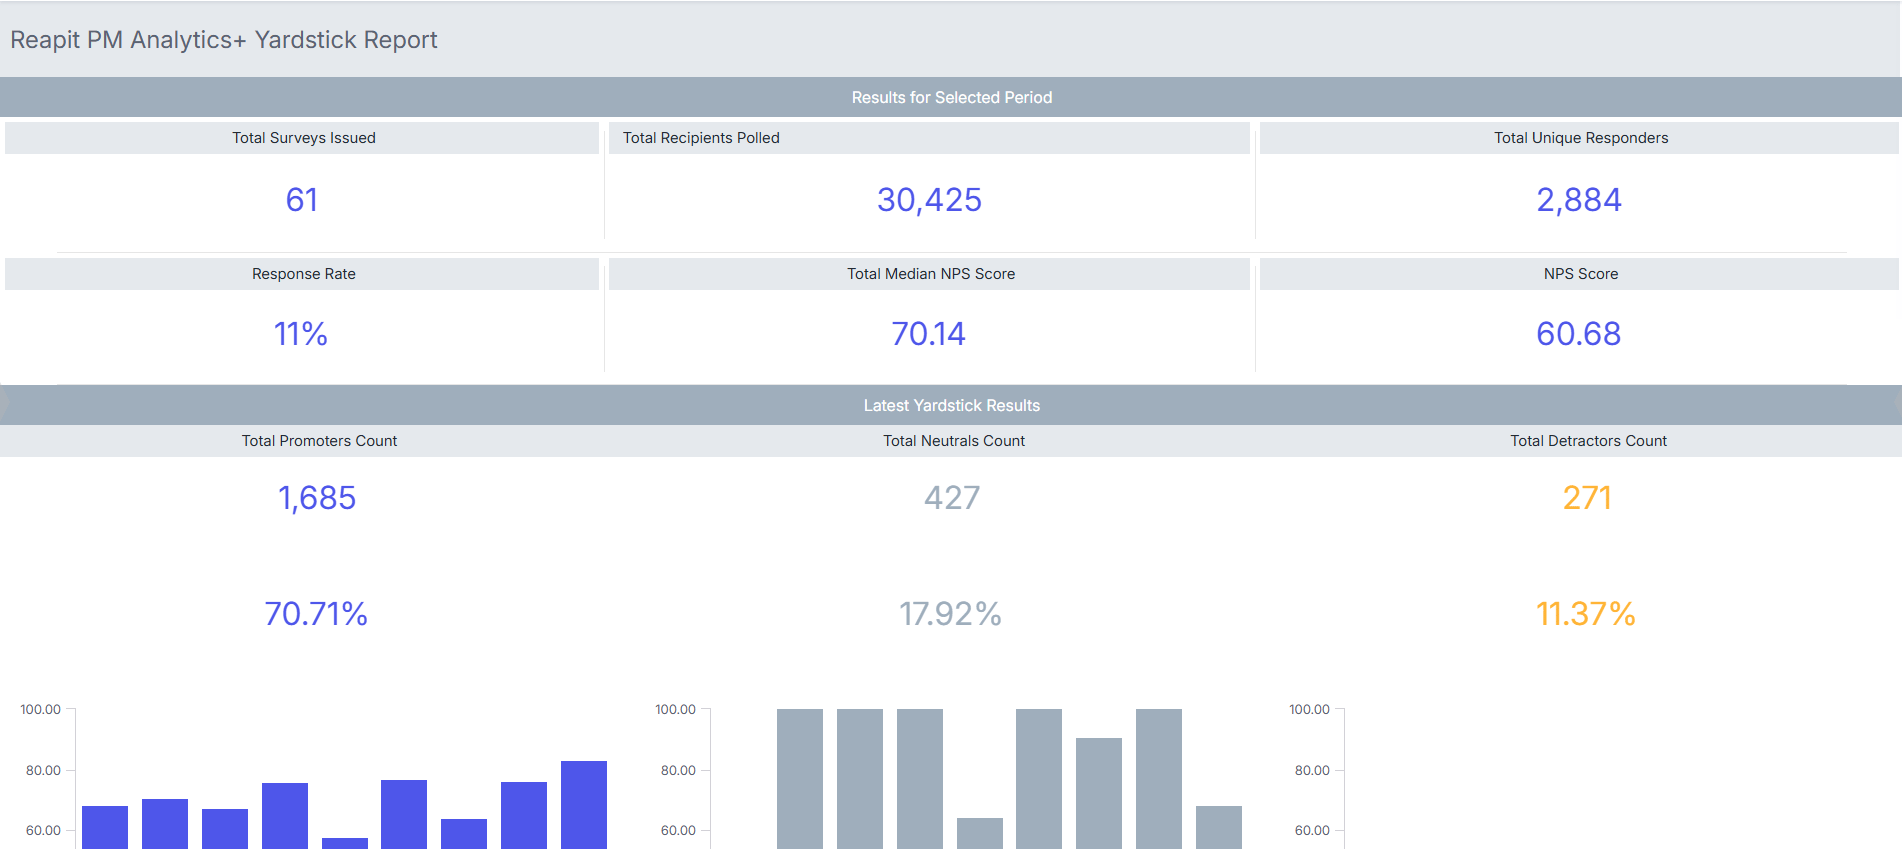
Yardstick Report
This report gathers data from the Reapit PM Yardstick feature (Owner NPS), and shows:
- How many NPS surveys have been sent
- How many owners responded to NPS surveys
- The median NPS score,
- The number of promoters, neutrals, and detractors.
- Tracking how respondents change over time.
Please note: This report only shows data if your office has used the Yardstick feature in Reapit PM.
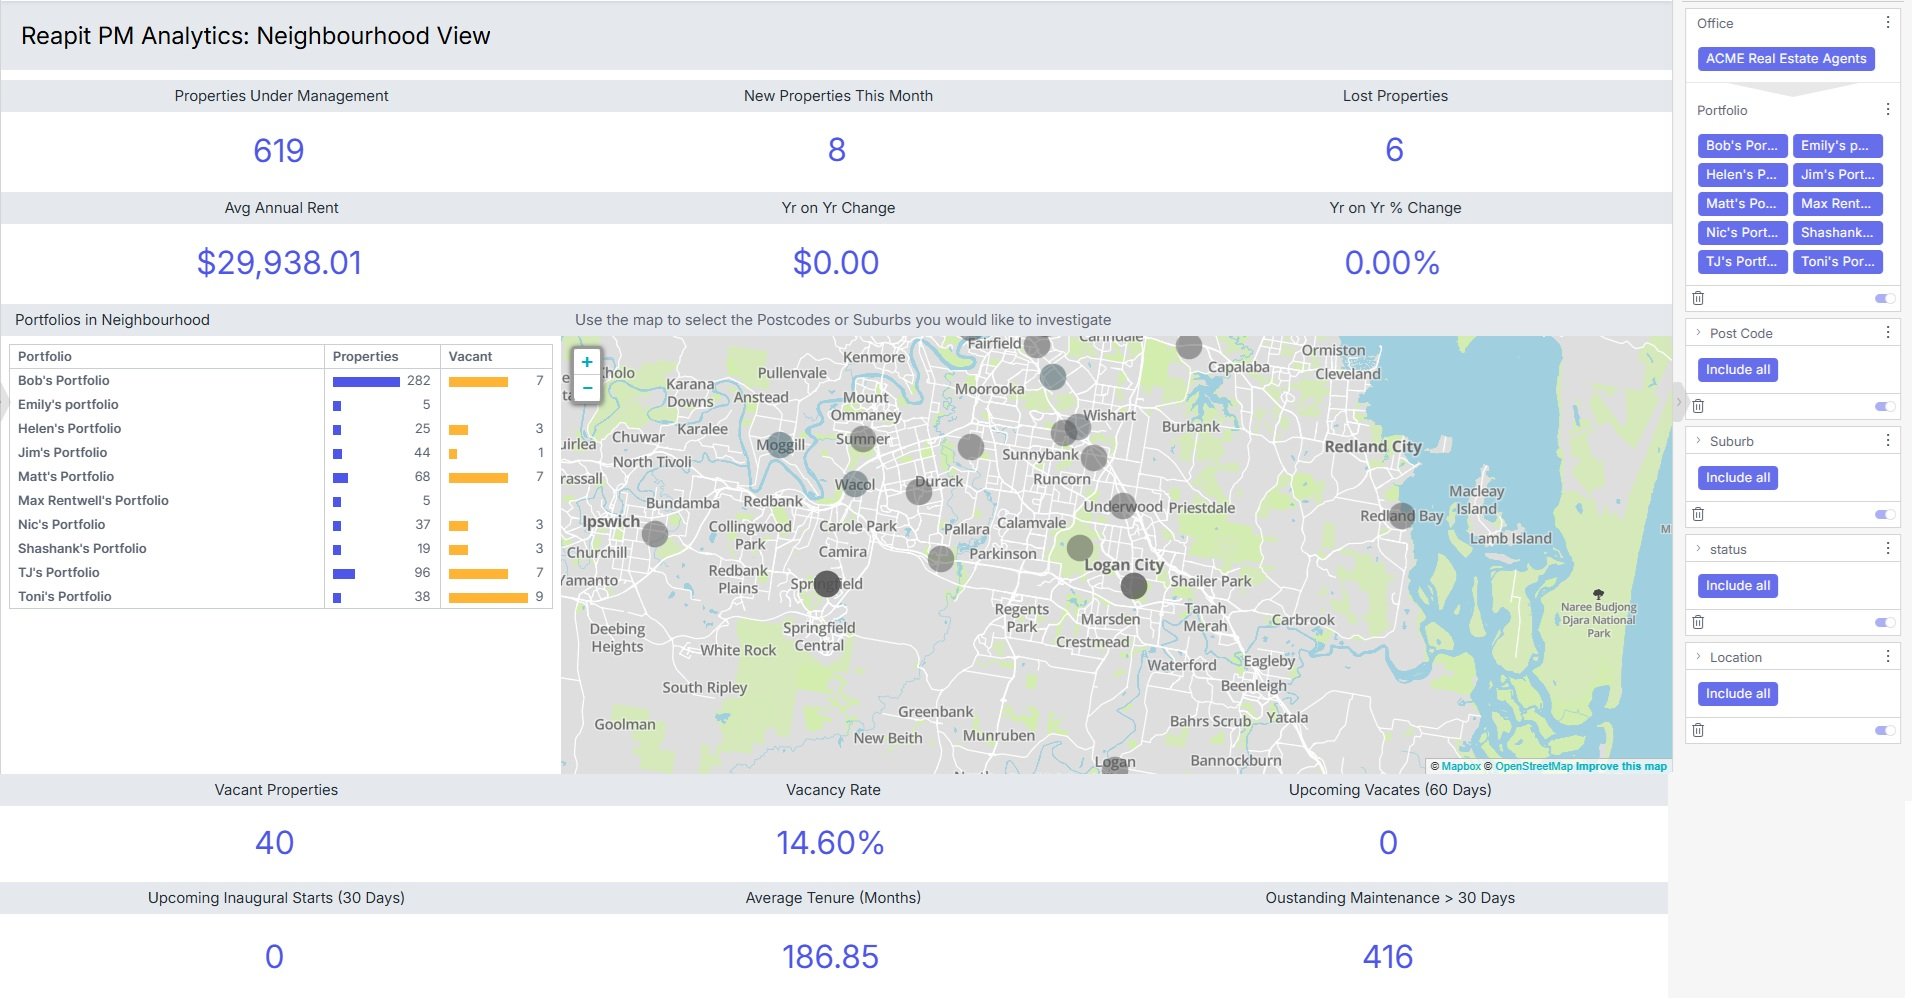
Neighbourhood Report
This report shows how many properties you manage in a given postcode, how many vacancies you’ve got, how many new properties you’ve gained, how many you’ve lost, and more, in one tidy view.
Reapit Activity Planner
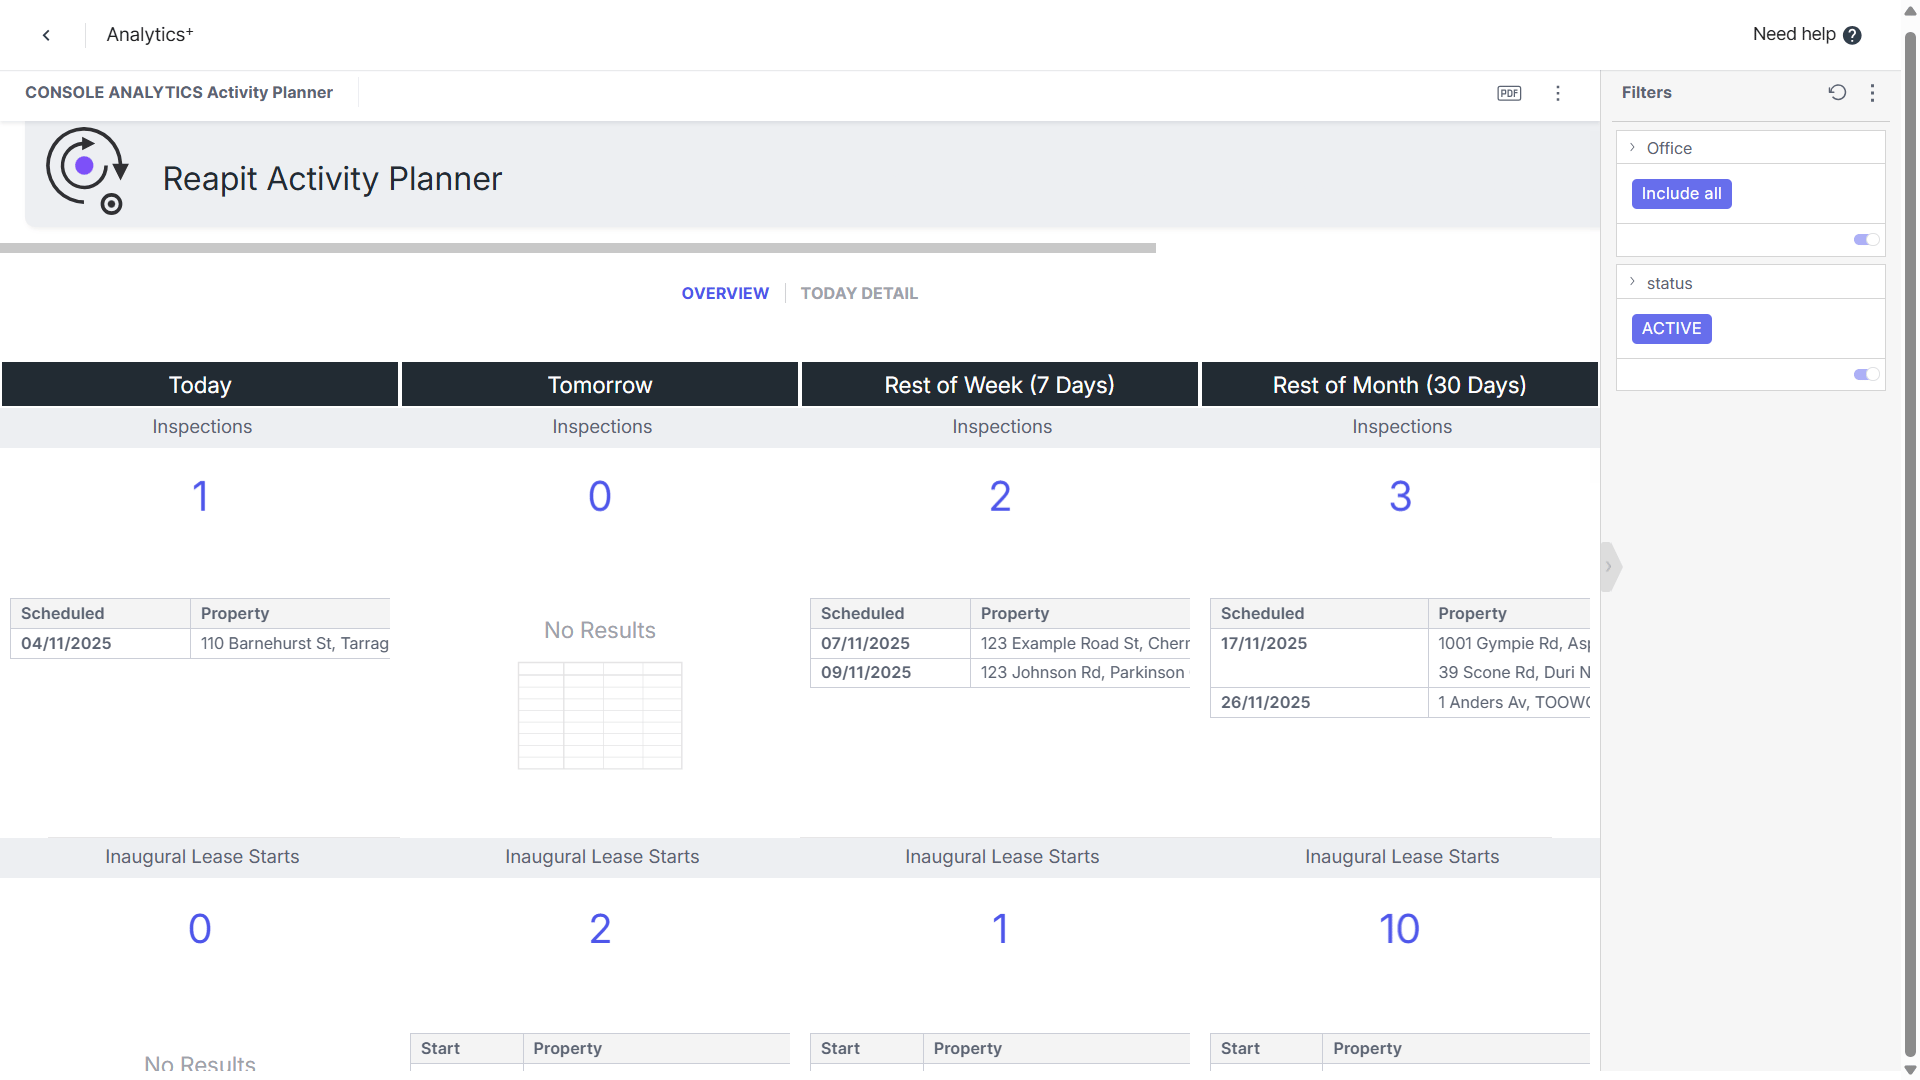
The Reapit Activity Planner provides a high-level summary of key activities occurring within the office. The Overview section displays rows of upcoming items based on four timeframes: today, tomorrow, the rest of the week (covering the next seven days), and the rest of the month (covering the next thirty days). This layout helps teams quickly understand what’s coming up and stay organised.
For more detailed insights into the current day’s events, the Today Detail view offers a more granular breakdown of scheduled activities, ensuring nothing important is missed.
Captured information includes:
- Inspections
- Inaugural Lease Starts
- Lease Ends
- Vacates
- Compliance Expiry
Reapit PM Analytics Central
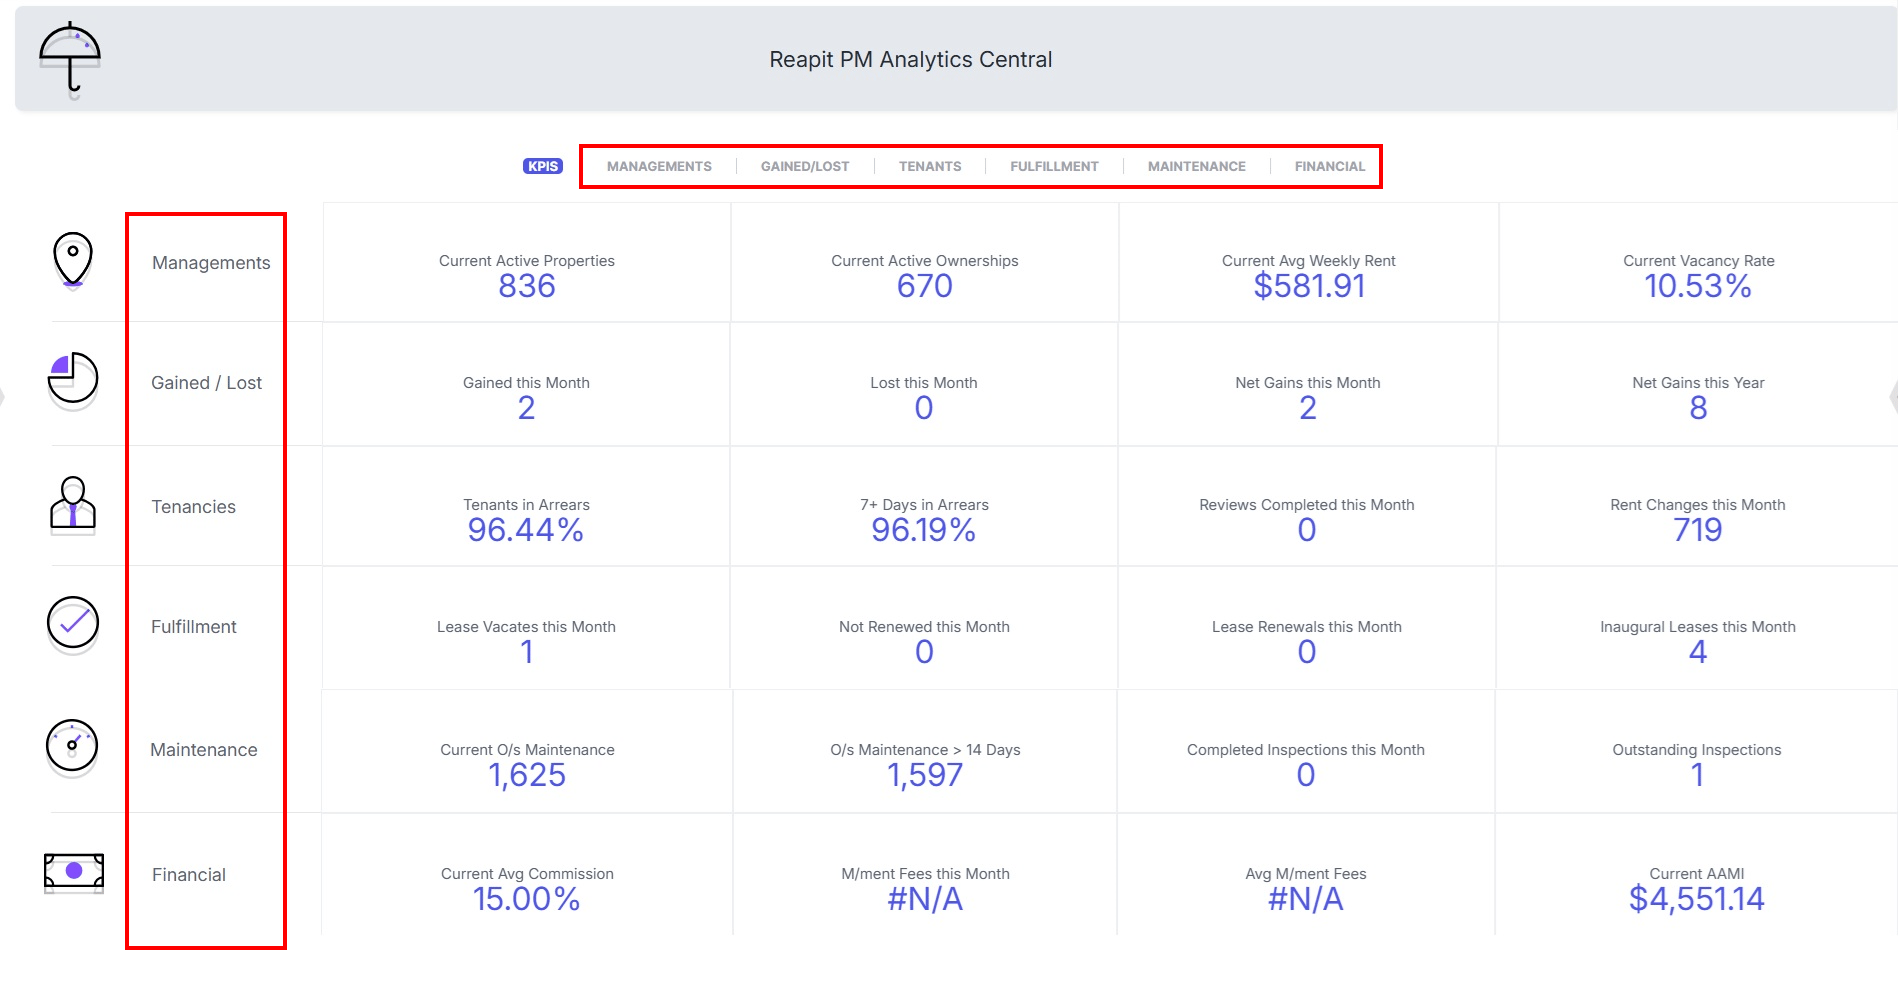
Reapit PM Analytics Central provides a high-level snapshot of KPIs across six core property management functions, displayed along the left side of the dashboard. For each function, four of the most relevant KPIs are presented offering users a quick and insightful overview of their performance.
Users looking for deeper insights into the data can click on the dedicated tabs on the top of the page where a summary of the relevant report is readily available.
Key metrics include:
- Managements
- Gained/Lost
- Tenants
- Fulfillment
- Maintenance
- Financial
Custom Data Report (Enterprise Users Only)
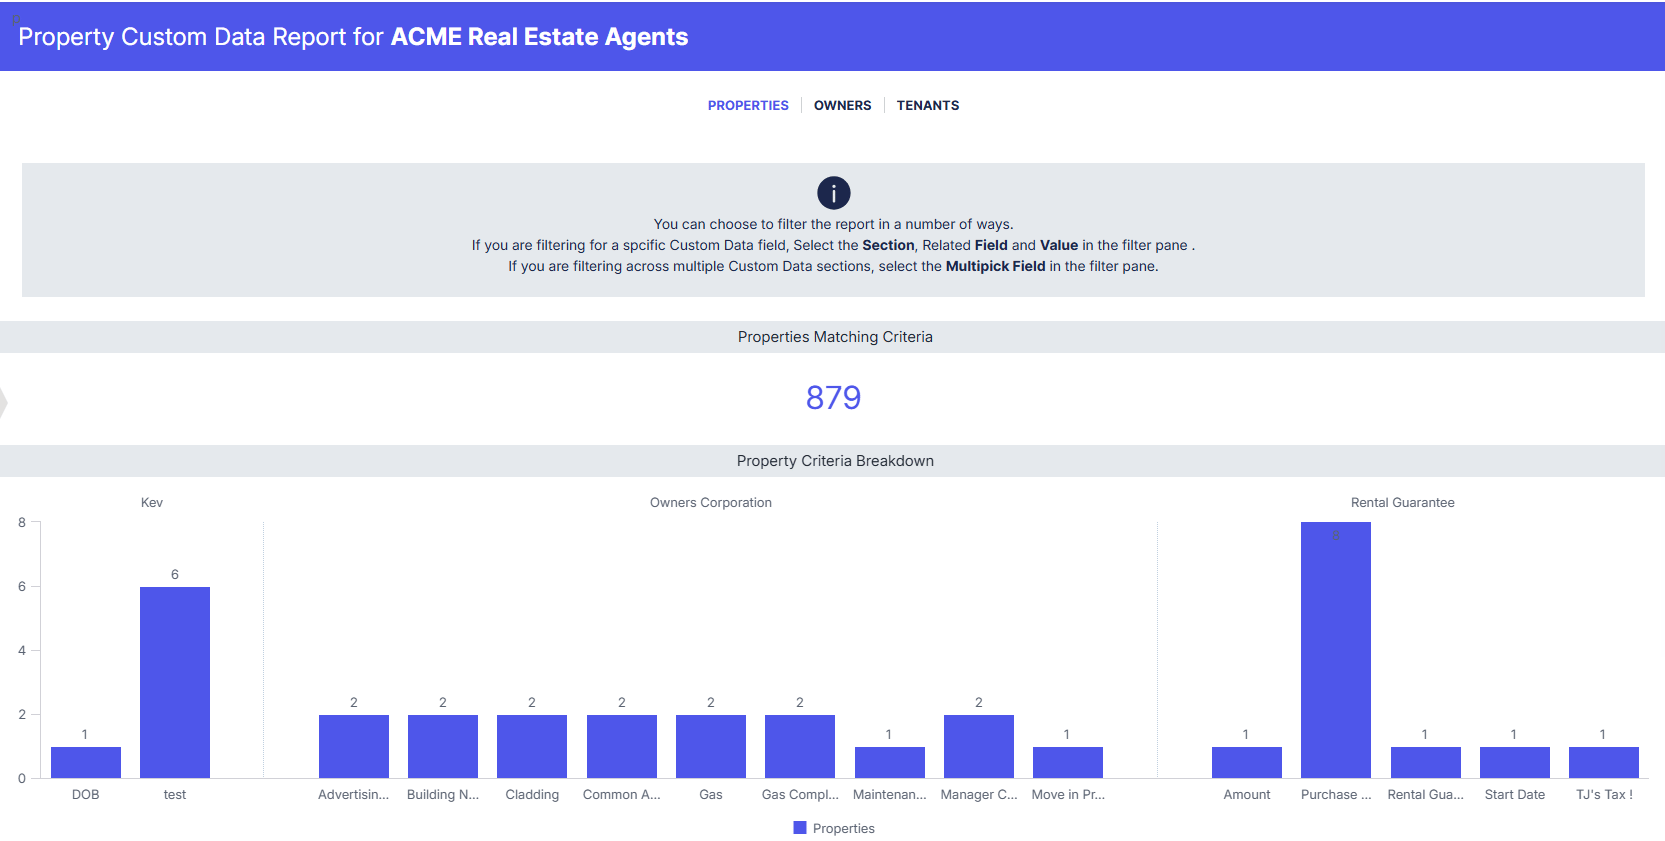
The Custom Data Report is designed to give Enterprise Clients the ability to filter entity data using the Custom Data fields created against Properties, Owners, or Tenants. This tool enables more targeted reporting analysis by leveraging the unique data captured for each entity.
Additional Information
- The report format ensures that two out of the last three columns are derived values to provide more insightful data.
- This structure aids in understanding the financial implications of the tenancy agreements, facilitating better decision-making regarding renewals or extensions.
- Click the three dots to select to download via either Image, CSV File or PDF File.
Schedule Reporting
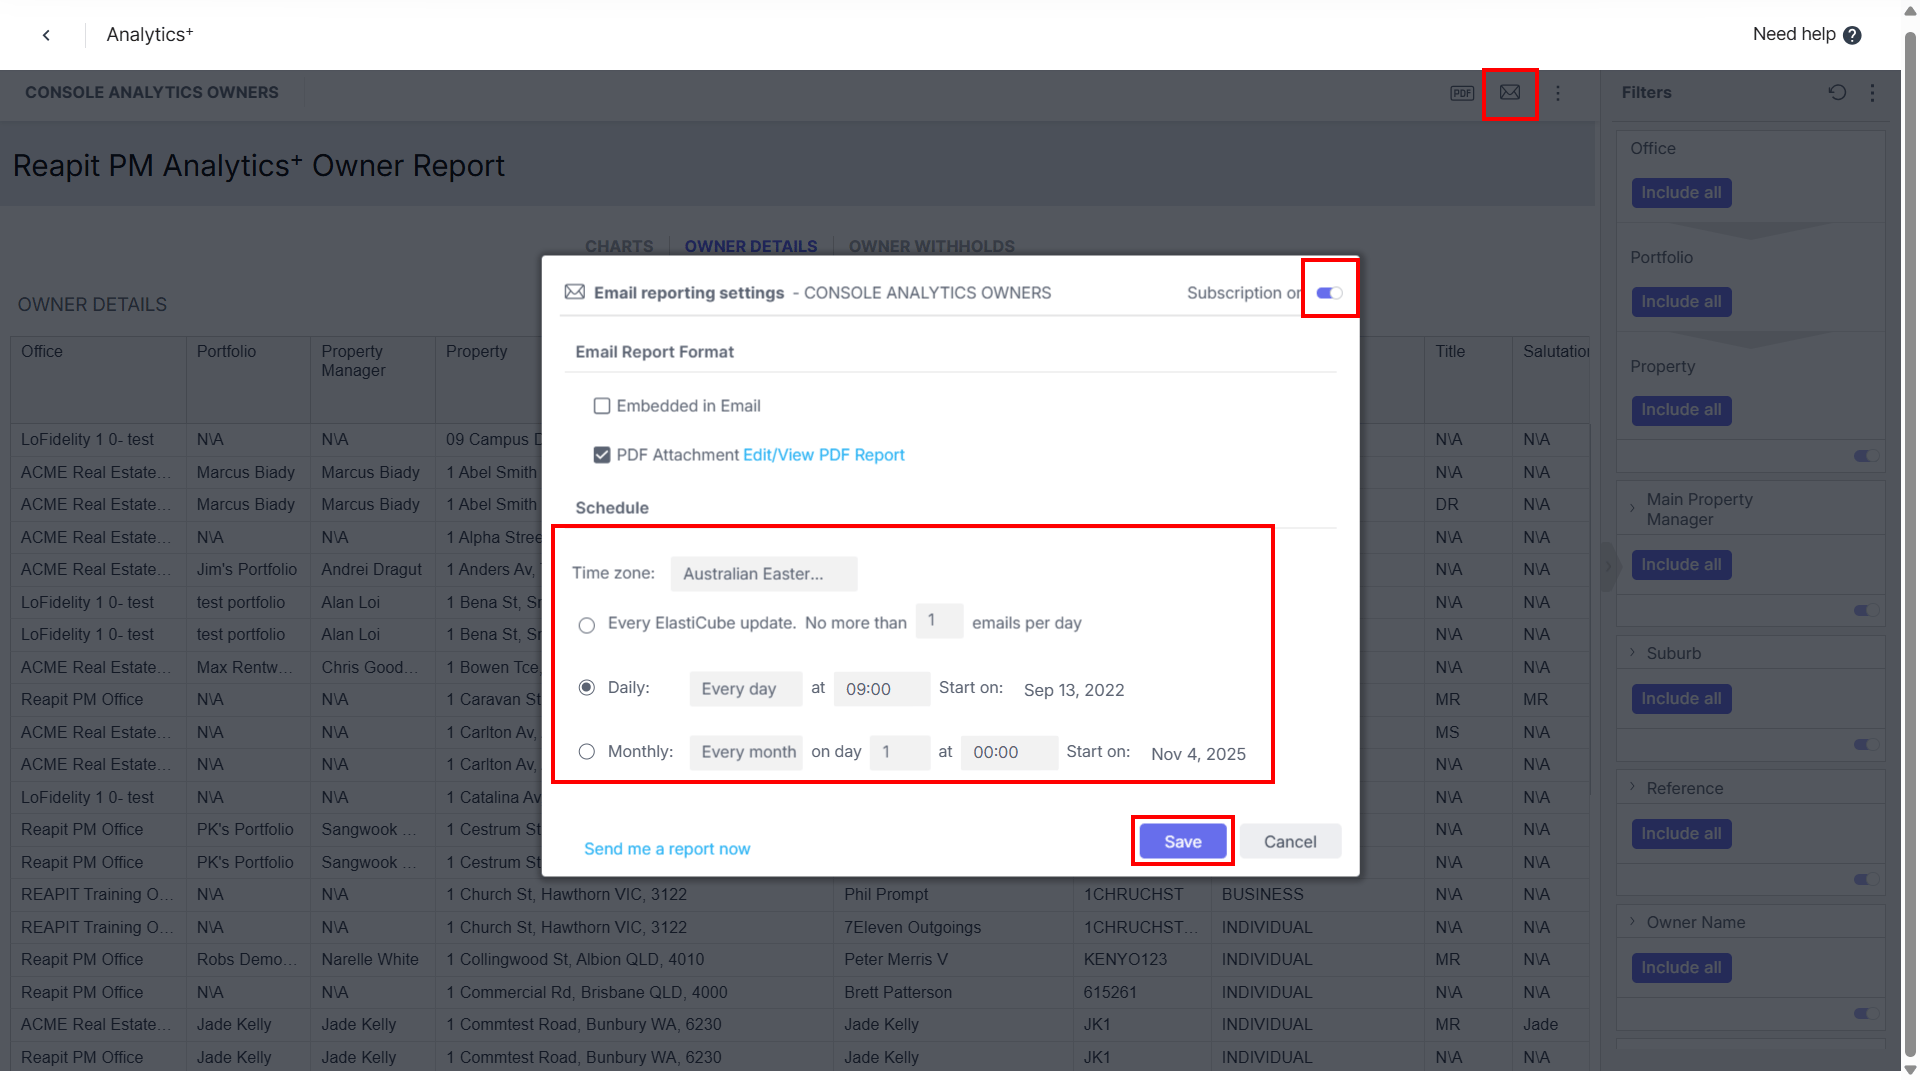
Analytics+ includes a convenient scheduling tool that allows users to automate report delivery. With this feature, any report can be formatted into a PDF and scheduled to be sent via email, ensuring timely access to insights without manual effort.
- Navigate to the desired report and click the Share button.
- Click Subscription on.
- Enter the scheduled time you would like the email report to be sent.
- Click Save.